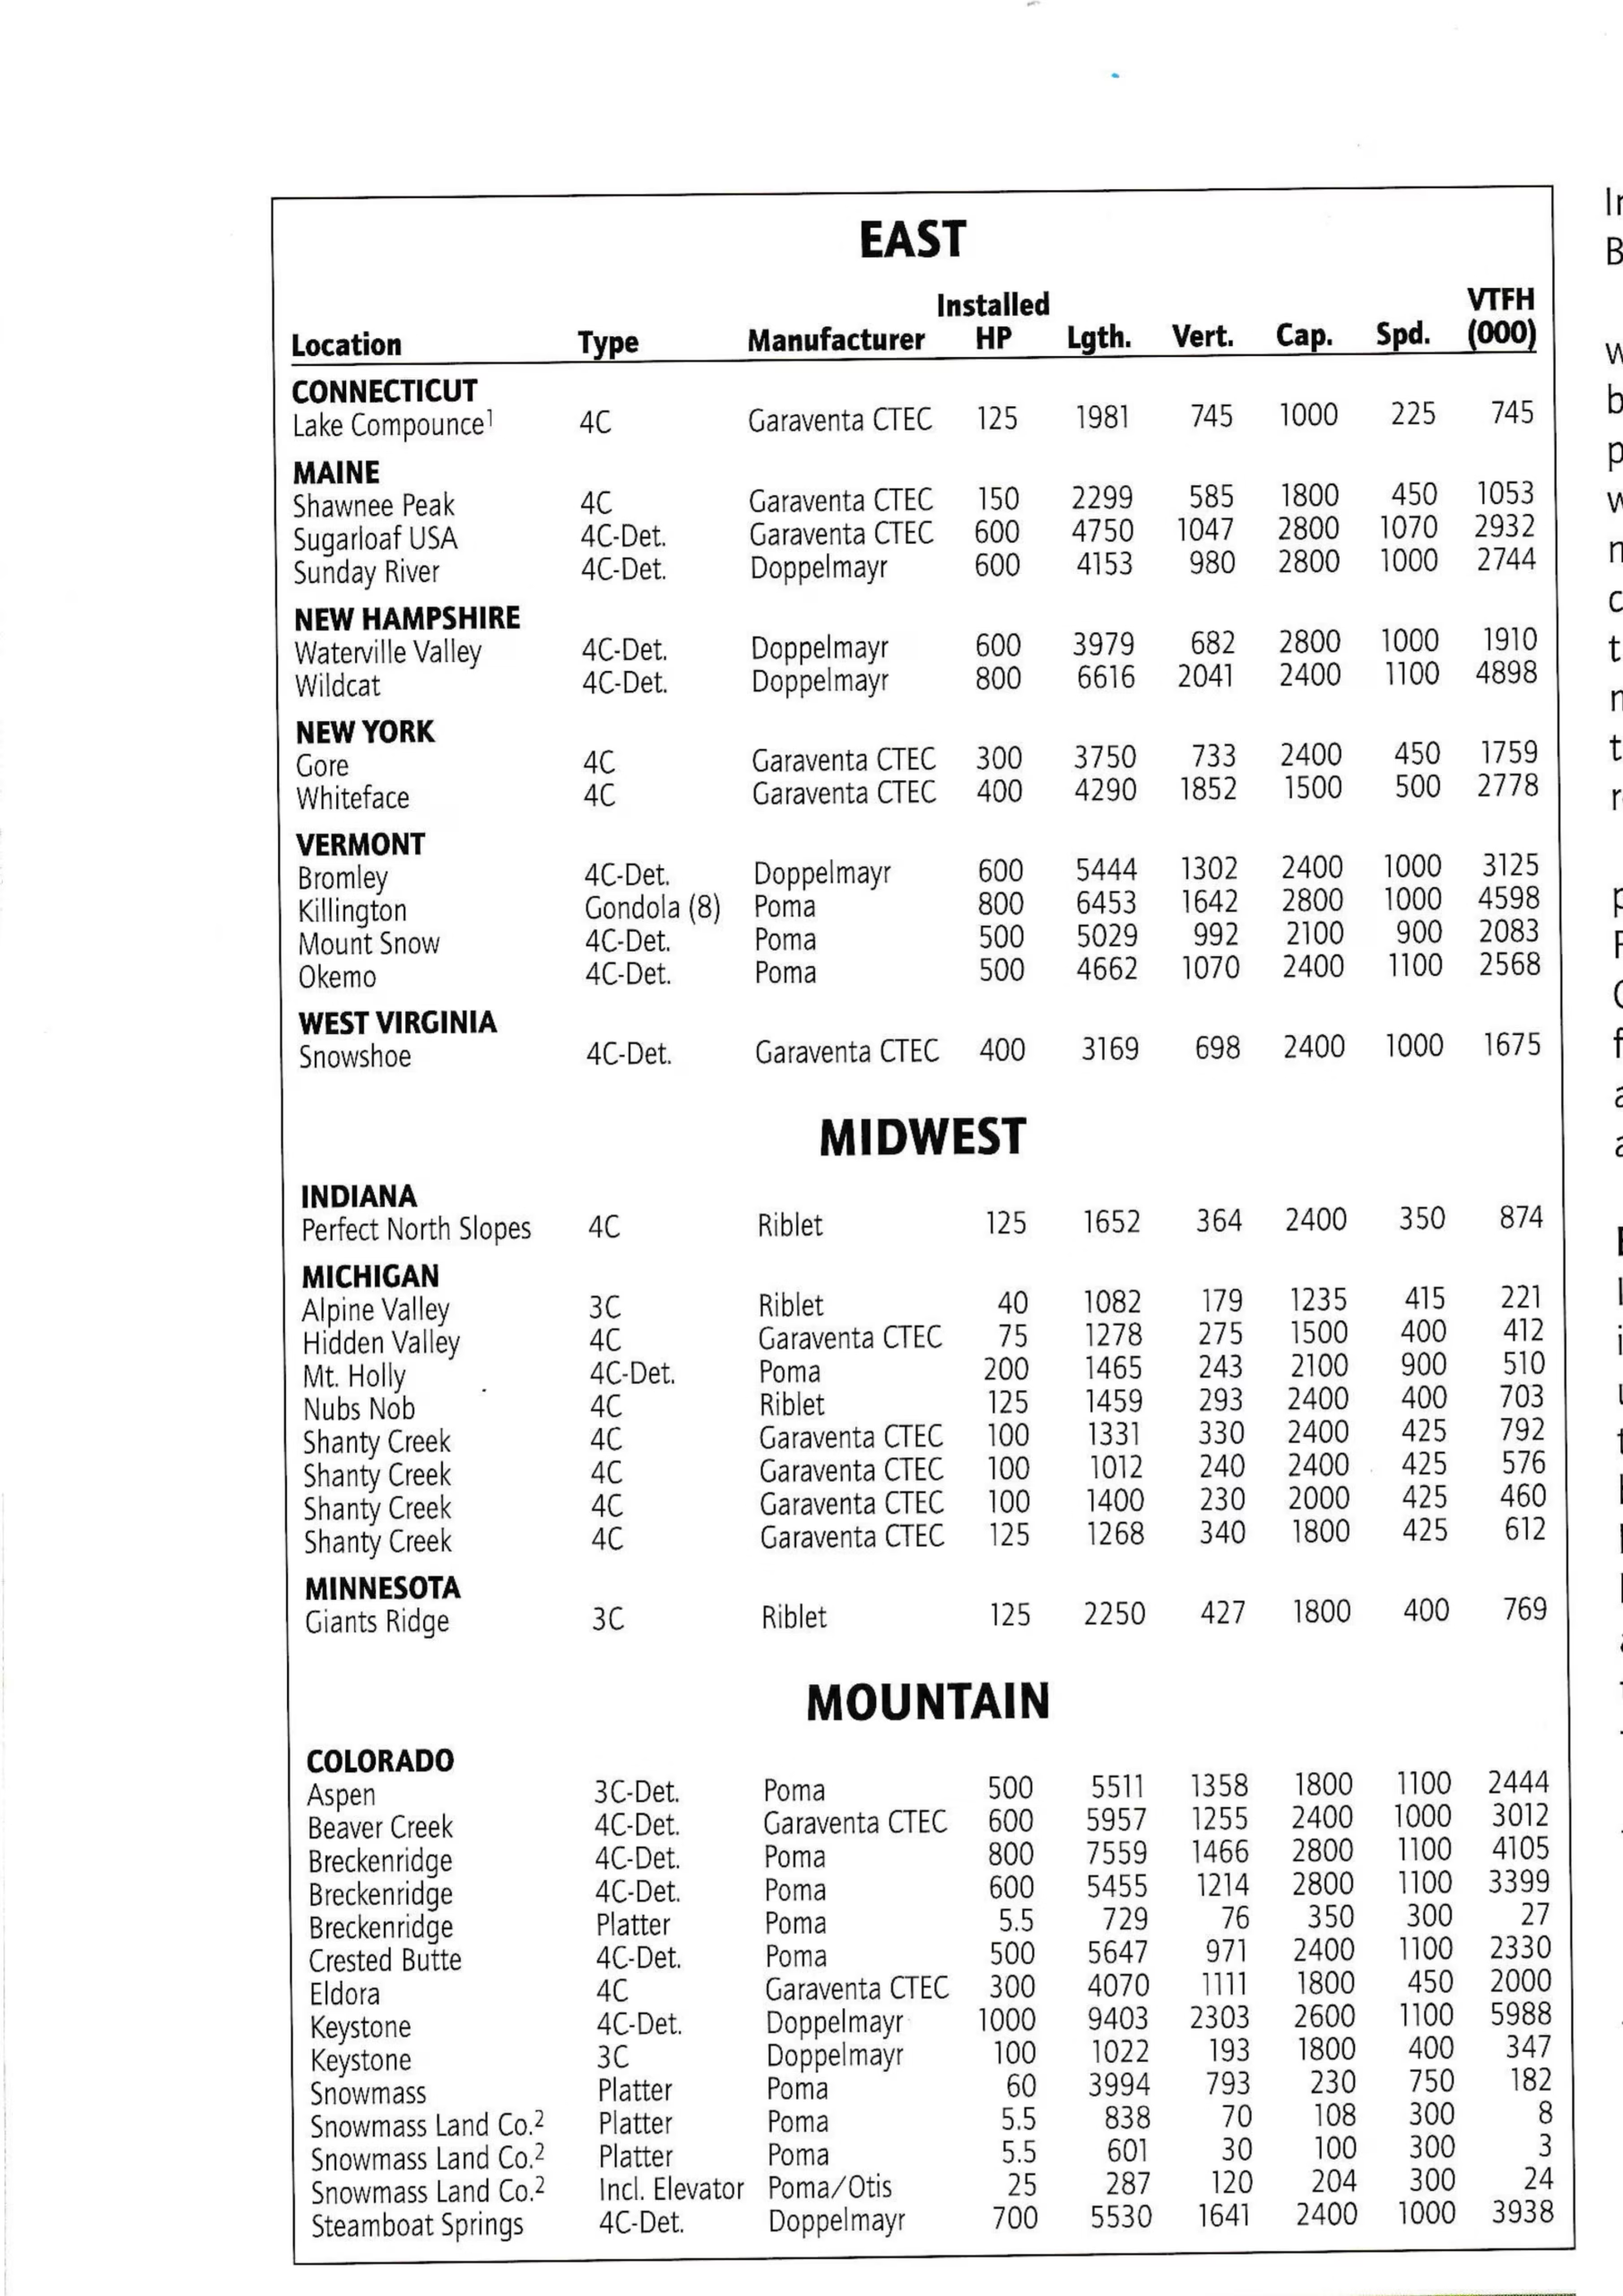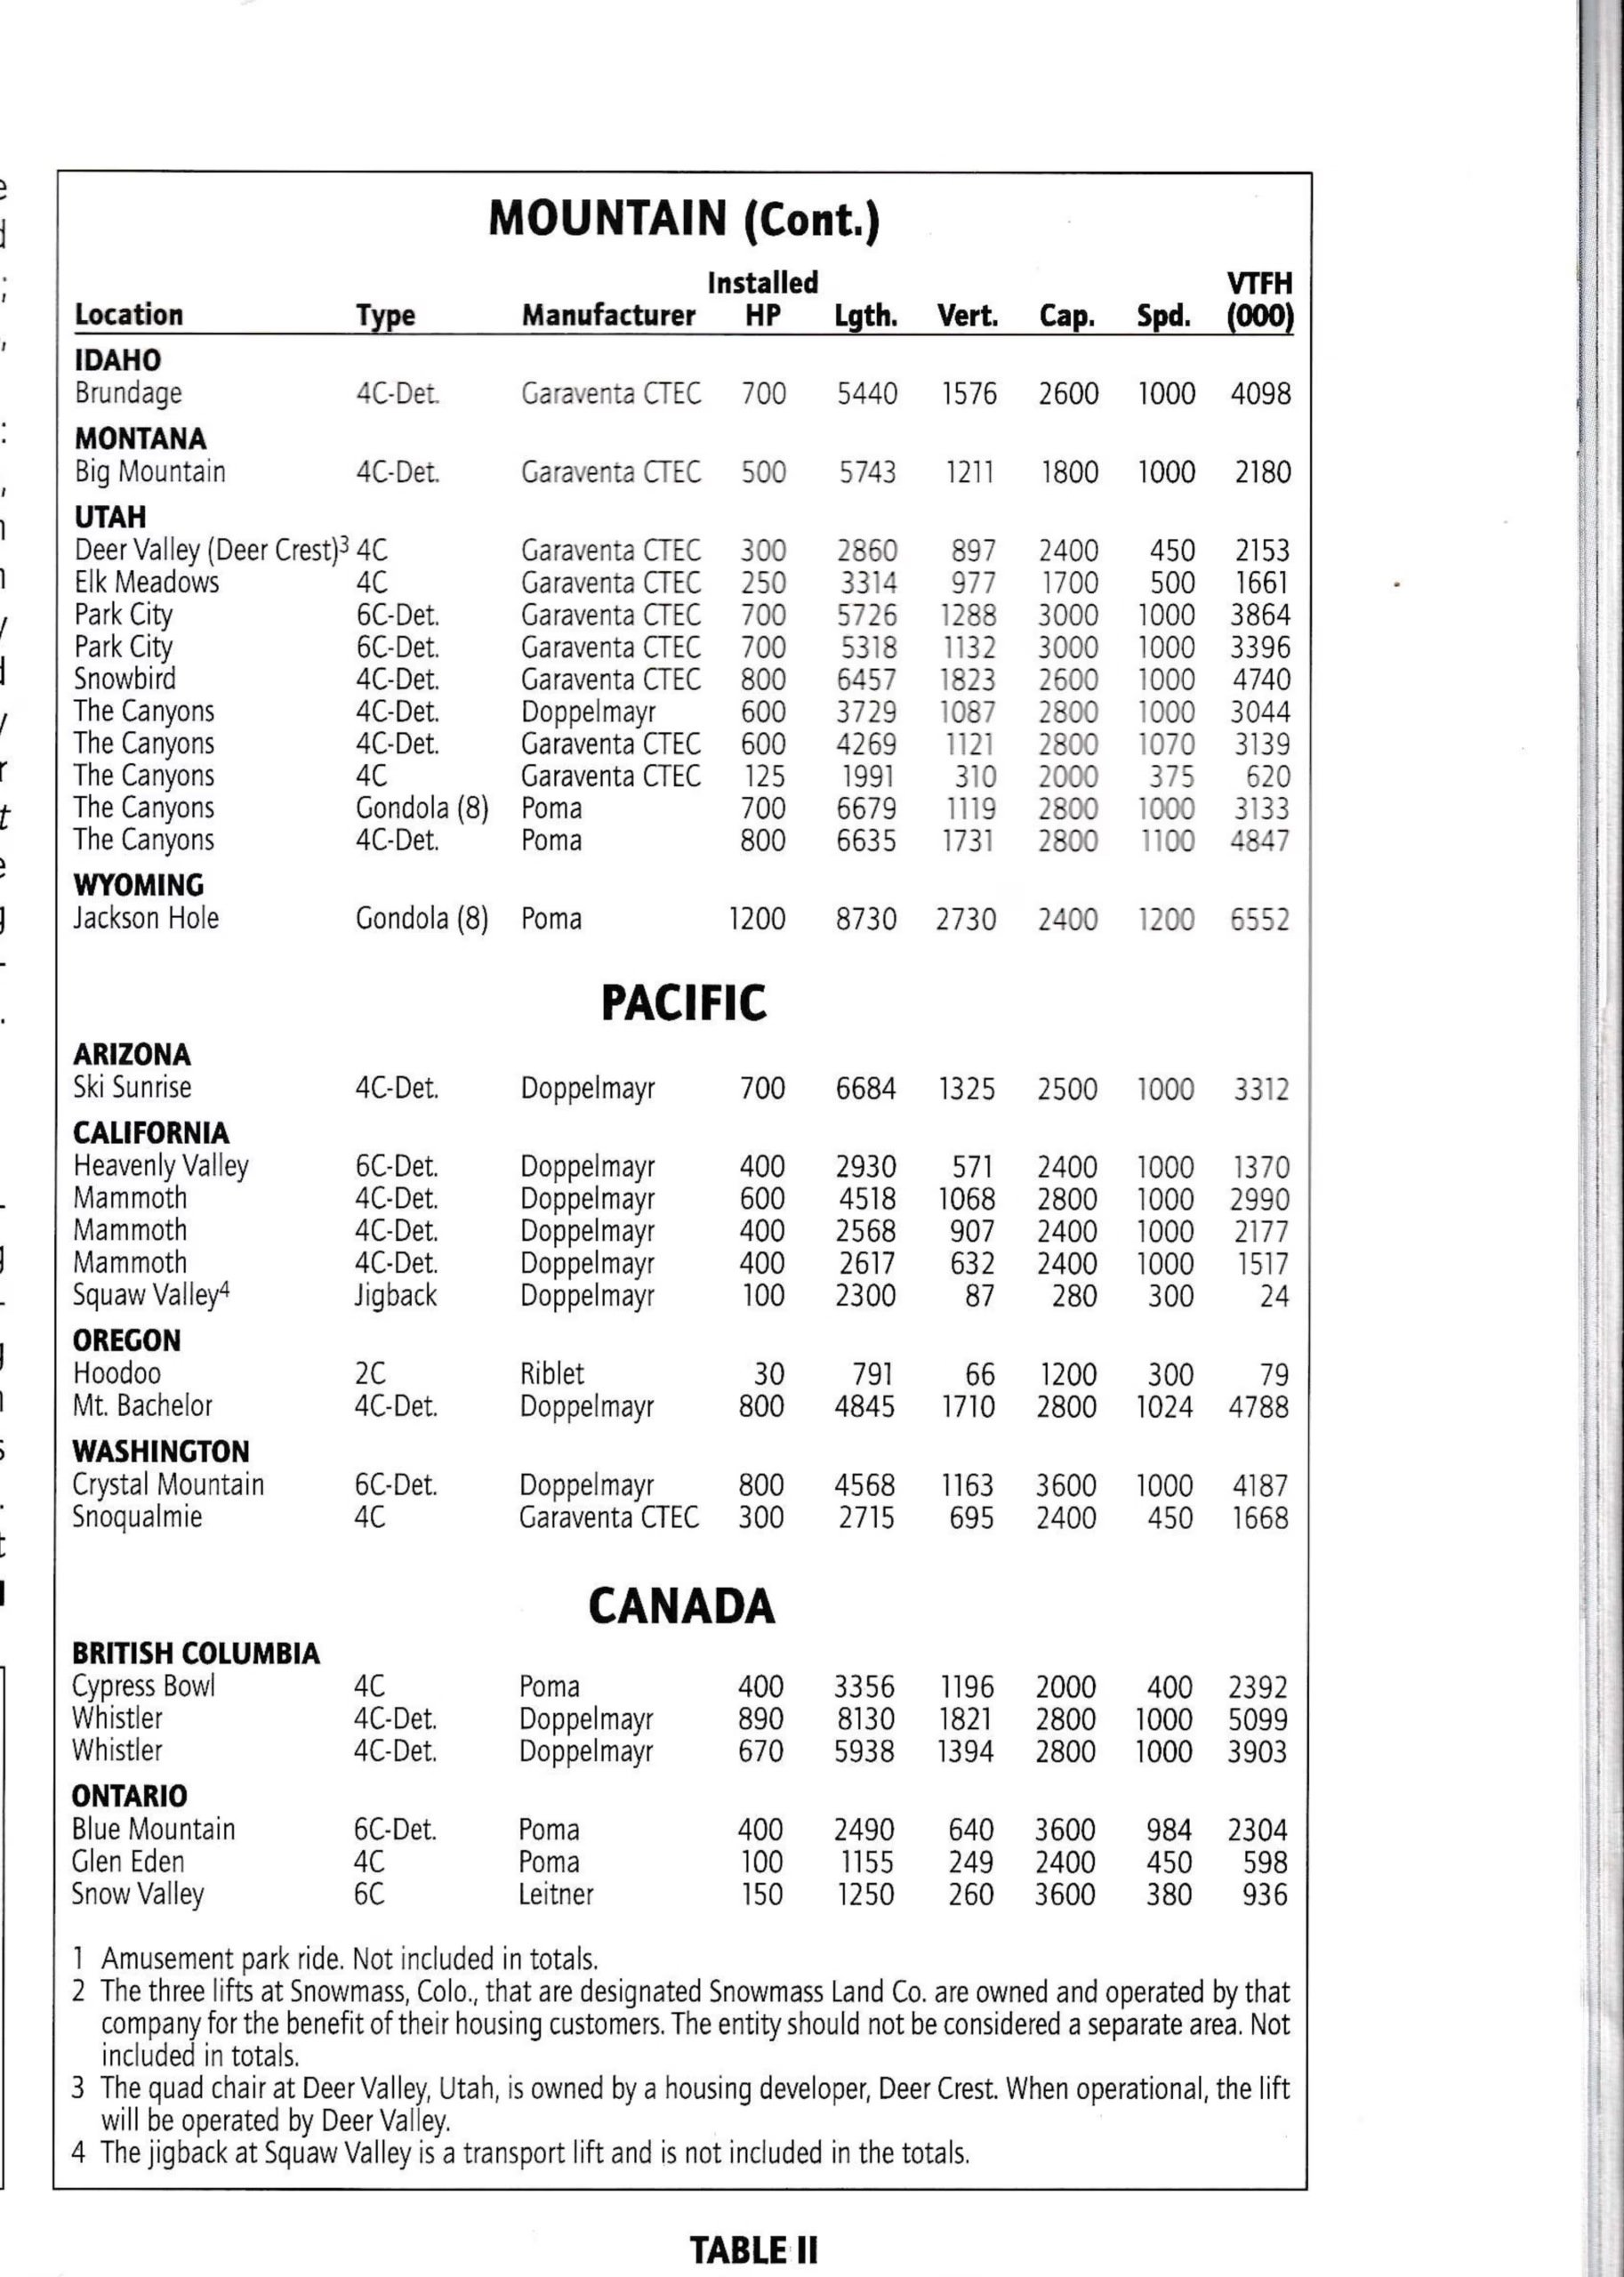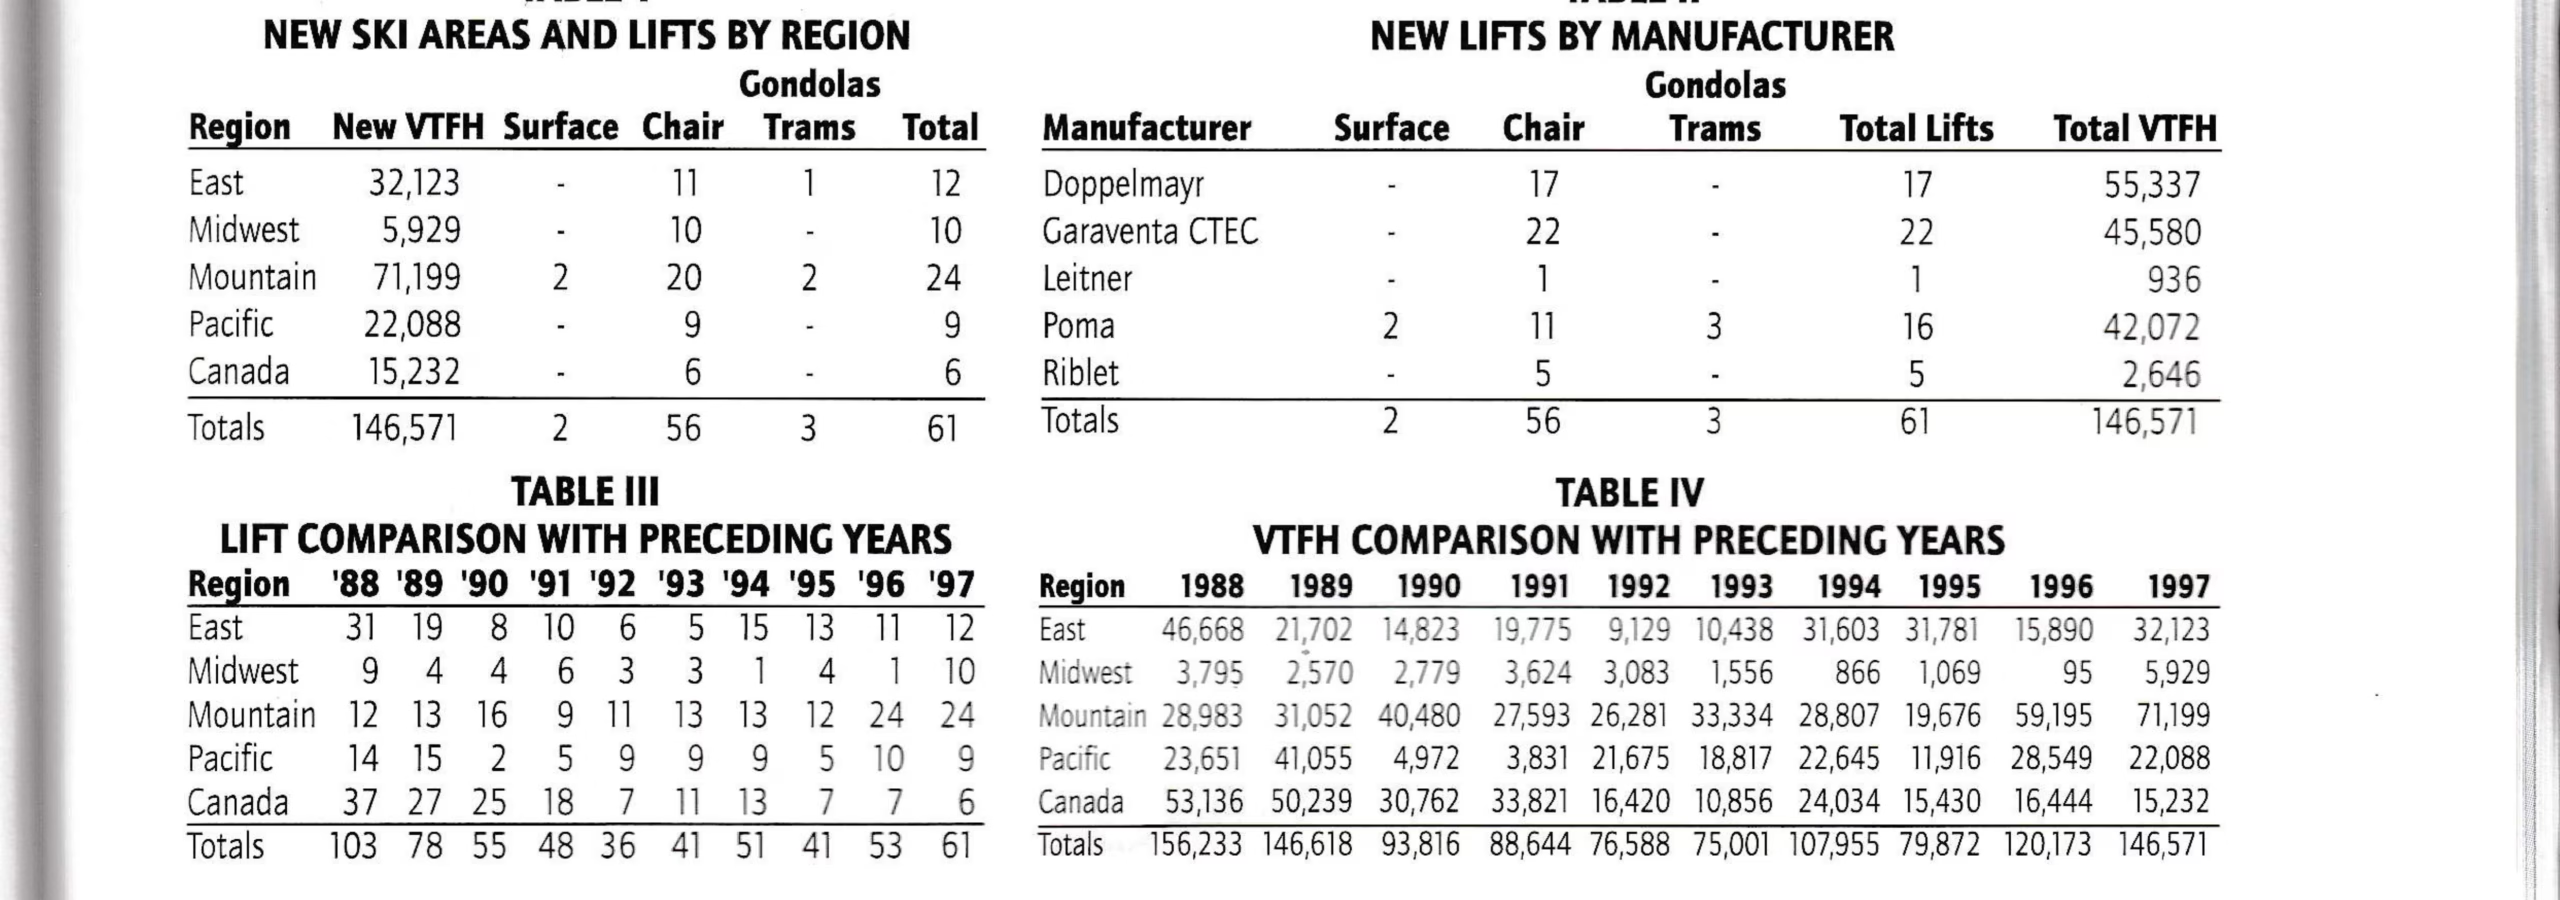


Total new Vertical Transport Feet per Hour (VTFH/000) comes out at an eye-popping 146,571 trailing only the 1998 and 1989 totals of 156,235 and 146,618, respectively. Equally impressive is the fact that this year’s total is 60 percent higher than the previous five-year average.
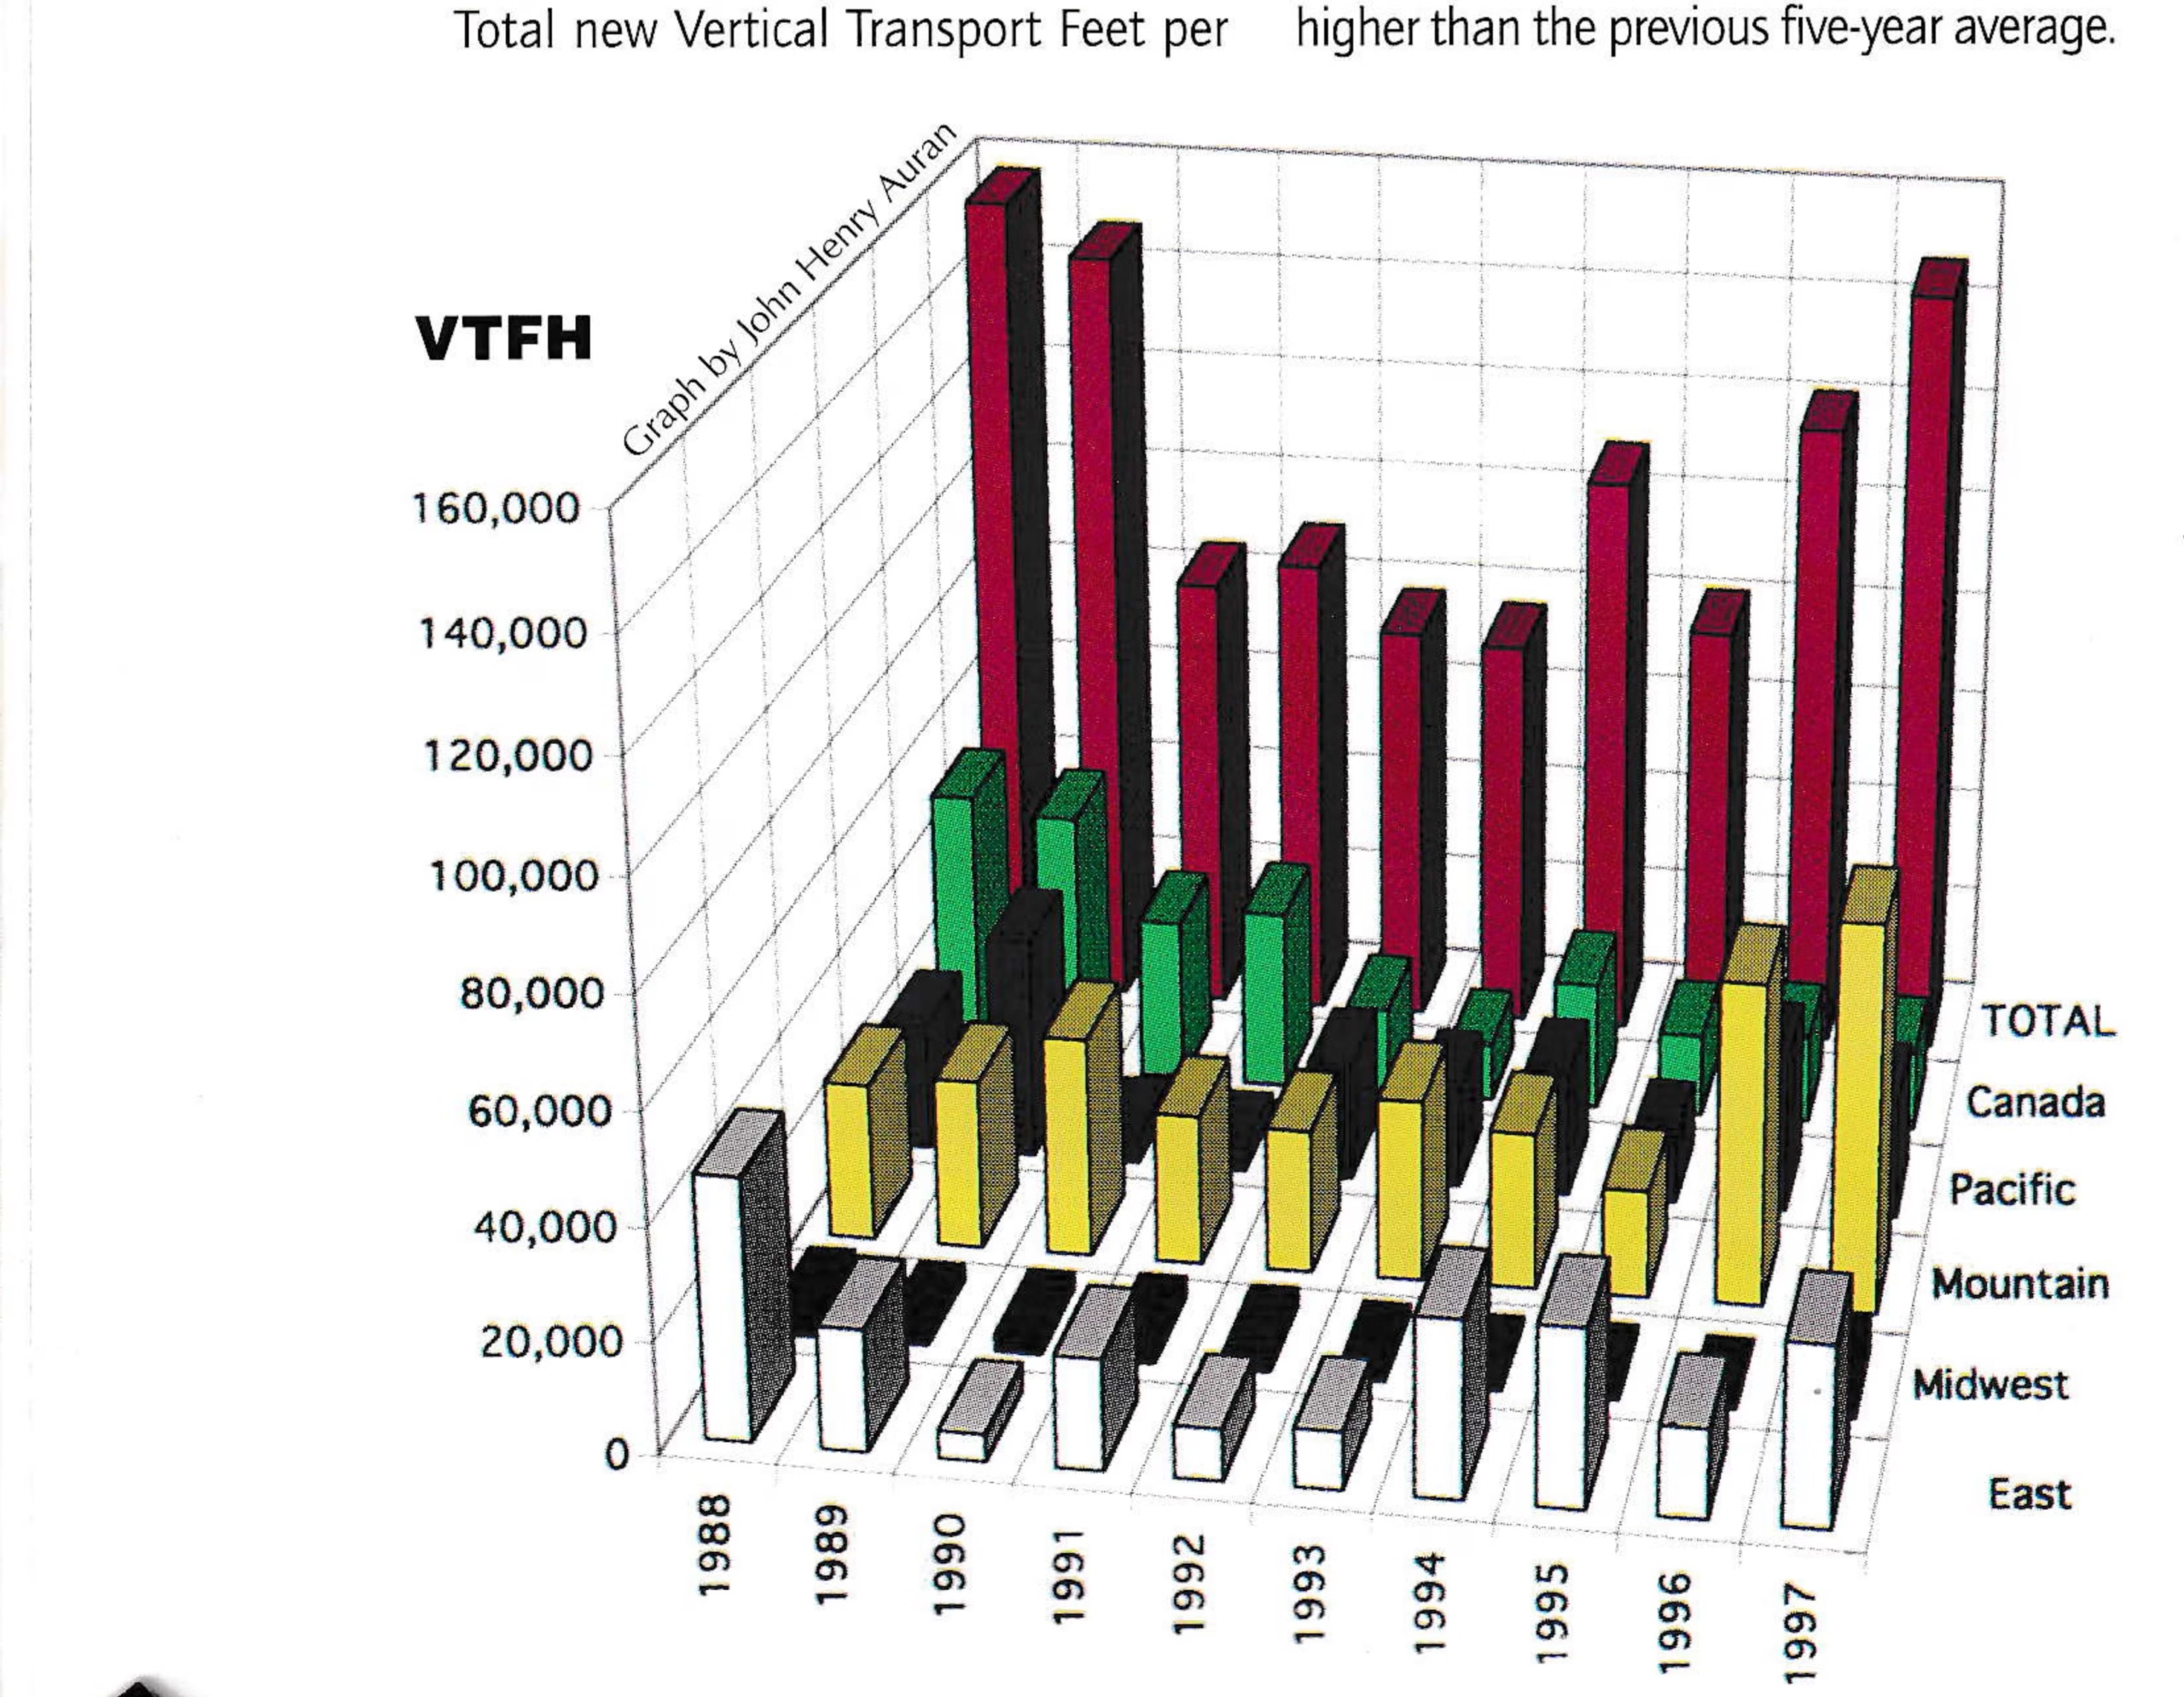
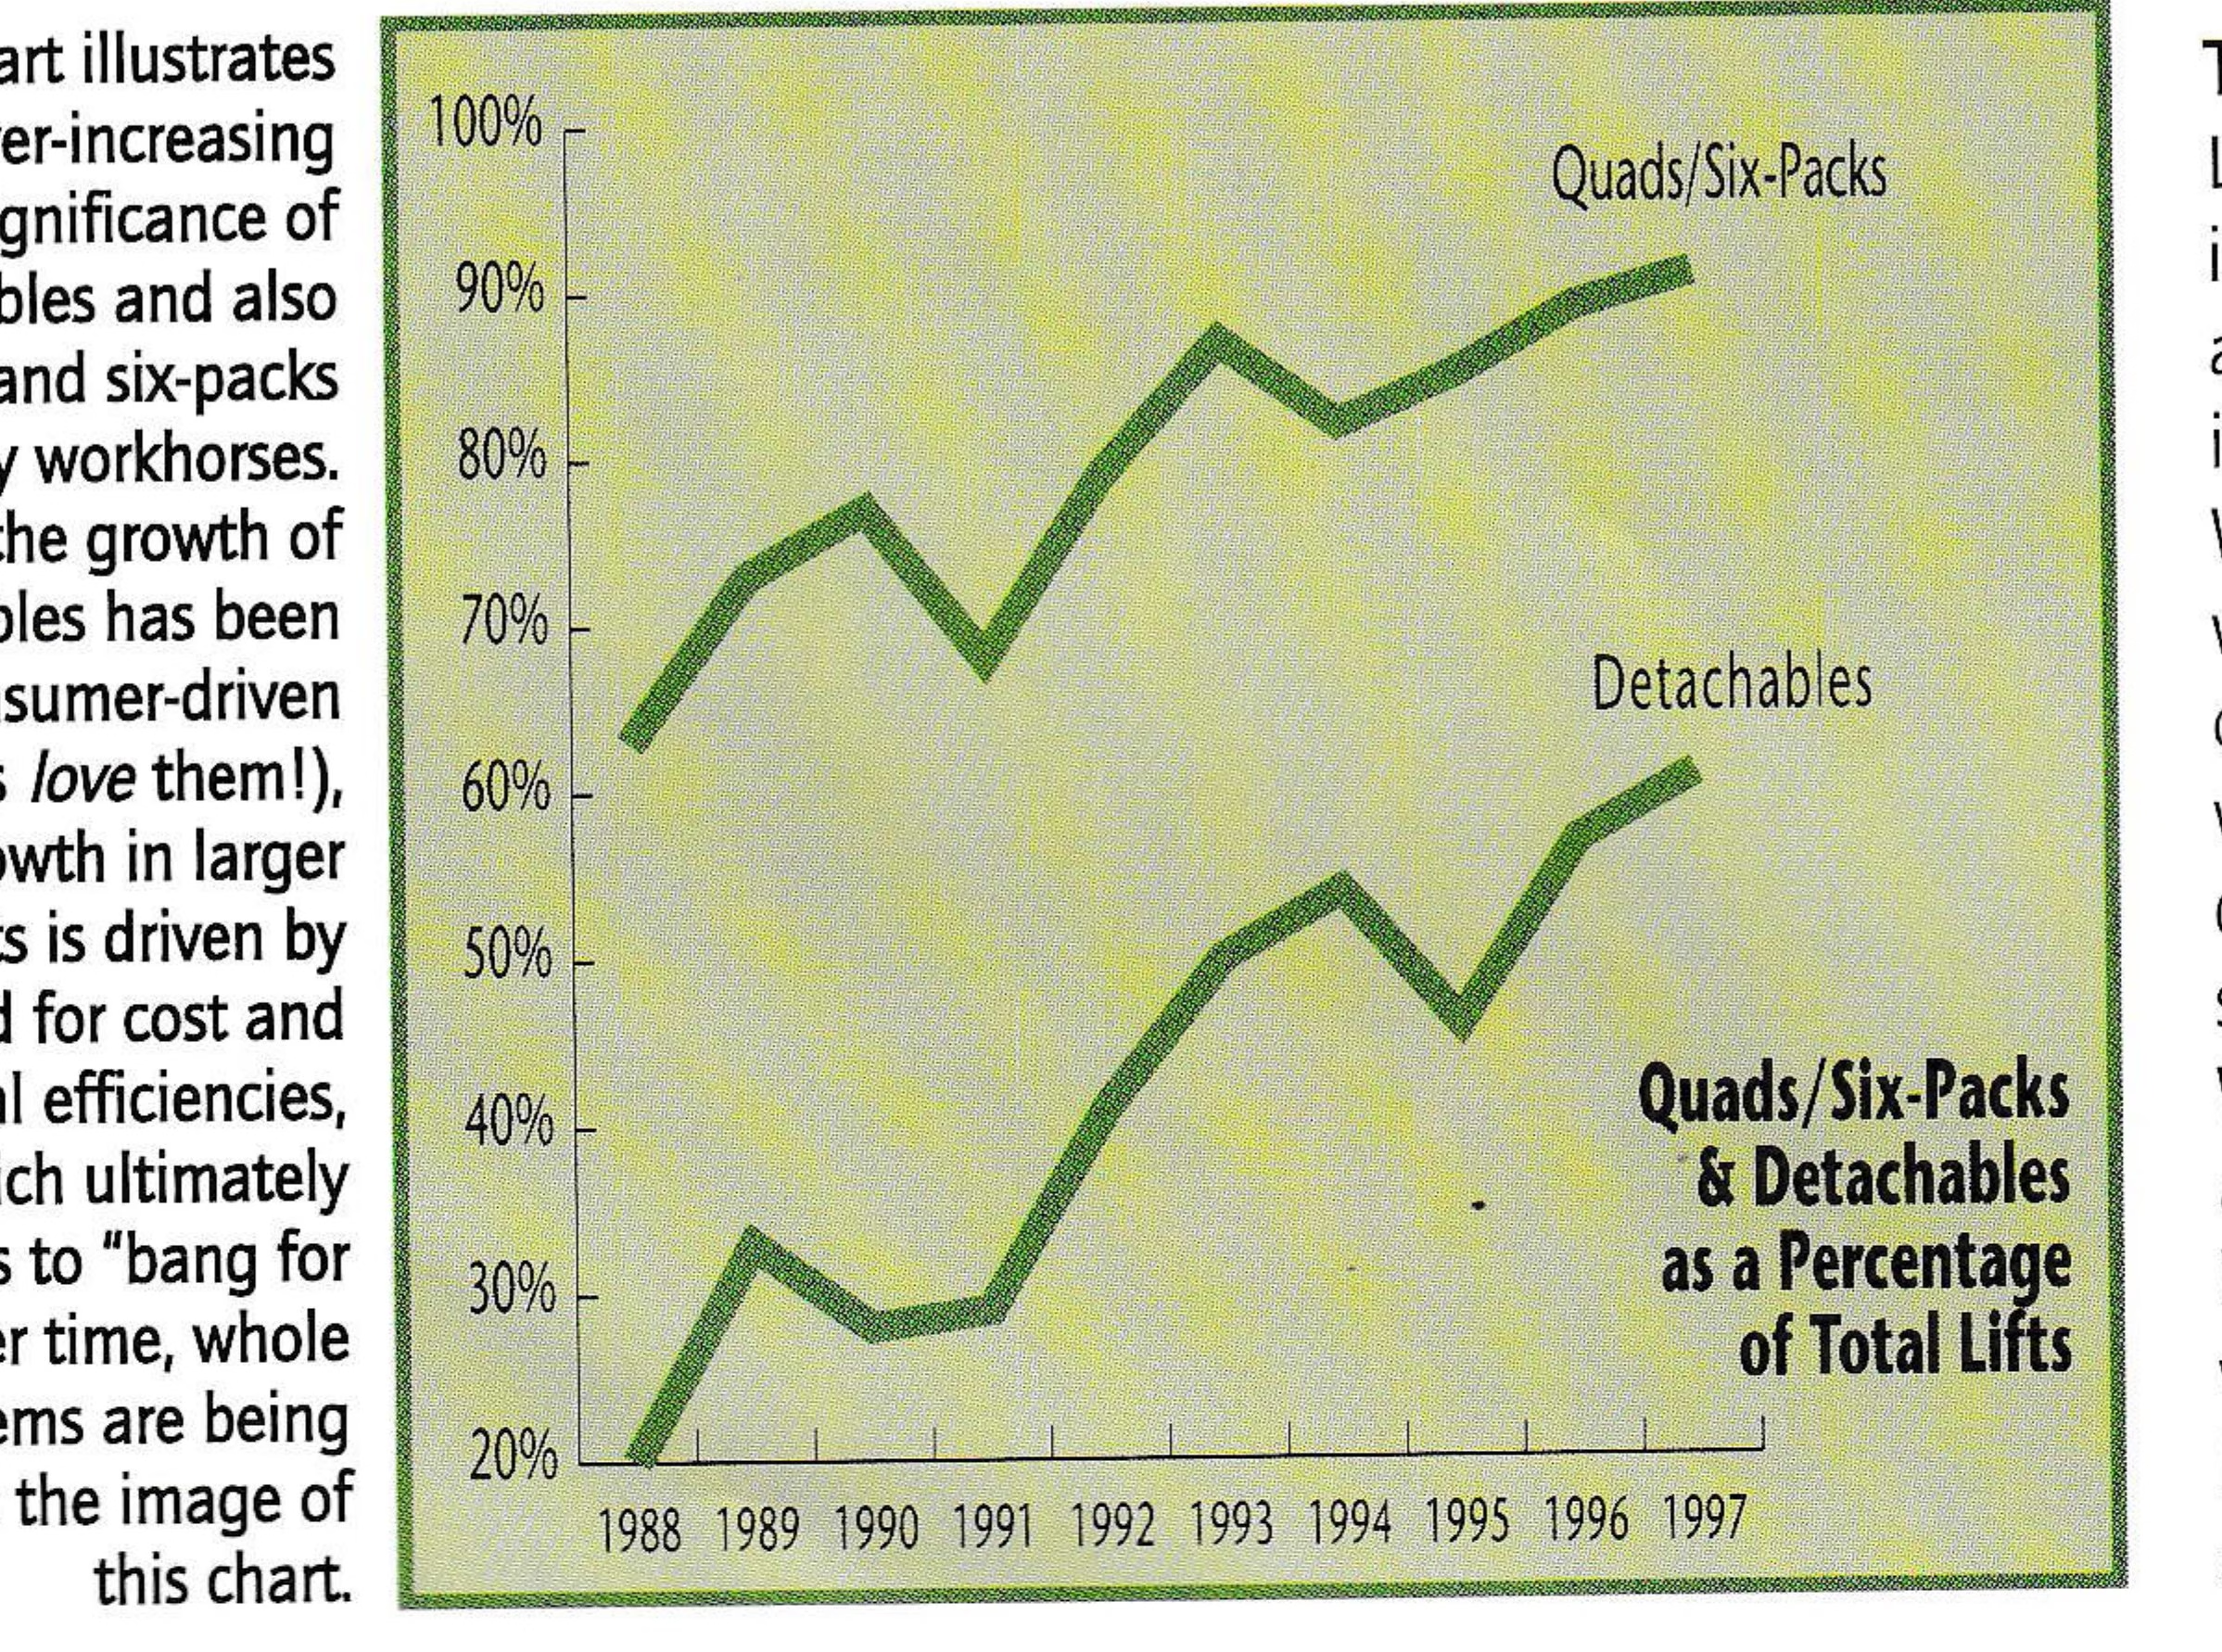
Graph by John Henry Auran
For the record, VTFH is the industry’s measurement of work performed, which tends to reflect quite accurately the level of investment. it is calculated by multiplying the vertical in feet by the capacity in passengers-per-hour. At SAM we divide the result by 1,000, making it a measurement of the number of people a lift can transport 1,000 vertical feet in an hour.
Leading the charge in new VTFH is an explosion of large chairlifts: 51, of which six are six-packs and 45 are quads. There were just four triples and one double in the mix. Of all 56 chairs built, 34 are detachable.
And in this swell of chairs we should not overlook three gondolas, all of them beefy eight-passengers by Poma.
A significant factor is that more than half of the lifts counted this year are “replacement” ones—ample proof, if such were needed, that our industry is quickening its pace of bringing whole lift systems up-to-date. If one could imagine wiping the slate clean and starting all existing North American ski areas from scratch, there might be one-third as many lifts serving them, but they might well deliver half again as much total VTFH. This is the direction we are going and will continue to go for some years to come: more muscle, less staffing, more efficiency, better skier distribution. And, one hopes, more fulfilled customers.
Effects of Consolidation
In this period of dramatic consolidation of ski resorts, it is worth analyzing how much of the investment in uphill transportation is coming from the “big four” conglomerates. Taken together, their Investment in 63,531 VTFH represents 43.3 percent of the total being installed. American Skiing Company (ASC) leads the pack, with 32,398 VTFH, representing 22.1 percent of all new VTFH. Vail Resorts is in second place with 16,878, representing 11.5 percent, followed by Intrawest’s 10,677 (7.3 percent) and Booth Creek’s 3,578 (2.4 percent).
How did these big buyers spread the wealth? it was an interesting year because the “big three” suppliers (Doppelmayr, Garaventa CTEC and Poma) were all maxed out on their production, not only with new lifts but with modifications and re-engineerings. in addition to a huge amount of work on modifying and re-engineering Yan lifts, there was more than the usual quota of relocations.
As it turned out, Doppelmayr did 40 percent of the big four’s new VTFH, Poma did 35 percent and Garaventa CTEC, 25 percent. Business from the big four represented about one-third of Garaventa’s business, whereas it was about a half of both Poma’s and Doppelmayr’s.

Boom in Tows and Conveyors
It is not just the jumbo chairs that are flying off the shelf, it is also all the configurations of handle tows, wire rope tows, tubing tows, luge tows… you name it. As best we could count, 106 of them were bought for this season—more than twice last year’s total—and that doesn’t count a bunch that are being held in inventory to meet last-minute needs. As long as tubing keeps growing at its present pace, look for a lively market in the tows that serve this enthusiastic market.
Additionally, there are installations reported of no less than 12 conveyor-type lifts, used principally for instruction. Though typically between 50 and 100 feet in length, a 400-foot monster of the genre—this one a transport lift—was installed at Mount Snow, Vt., with a capacity between 2,000 and 4,000/pph.
Transport Lifts and Other Disclaimers
Lack of consistency in data is always an inherent problem for a report such as this, and the difference between design capacity and actual capacity is one of these. What about a gondola, for instance, whose capacity of 2,800/pph depends on a full complement of carriers, but where the ski area, for whatever reasons, decides to start operations with cabins sufficient only to deliver 1,800 capacity? We feel there is no alternative to listing the design statistics, since the discrepancy is based on operational decisions. Likewise, with Aspen’s new detachable serving Ruthie’s Run (see SAM July ’97), which is an off-the-shelf triple that Aspen elegantly loads as a double. As a measure of investment and potential capacity (and as listed here), it is a detachable triple; to Aspen and to its delighted customers, however, it is a detachable double.
We also point to another conundrum: transport lifts. Squaw Valley, for instance, will now provide transportation from the restaurants and activities of High Camp to those of Gold Coast. If they could have used a shuttle bus, we would not have counted it as a new lift. But they actually installed a chic new jigback for the purpose. We do list this, but do not include it in the statistical totals because it is a transport lift. The same reasoning applies to the inclined elevator and a couple of small surface lifts at Snowmass. They are transport lifts.
Summary
We started this commentary by disclaiming records for this lift-building year. We were wrong: this year’s crop averaged a whopping and record-setting 2,403 average VTFH. Putting this in perspective, the average 10 years ago was 1,517 and 20 years ago it was 715. A straight-line projection of what the next ten years might bring is scary!
| Manufacturer | Number |
|---|---|
| Borer | 8 |
| Brückschlögl | 8 |
| Harusch Fab | 6 |
| Leitner | 5 |
| Multerer | 31 |
| O’Connor | 35 |
| Schippers | 13 |
| Total | 106 |
| Manufacturer | Number |
|---|---|
| Brückschlögl | 4 |
| Magic Carpet | 5 |
| Sunkid | 5 |
| Total | 13 |