Recently while participating in the U.S. Forest Service-sponsored National Winter Sports Symposium in Denver, I listened as Vail’s Jim Bartlett talked about the “delicate” economics of the ski industry. A little later Sno-Engineering’s Chet Winter discussed at length the “balance” necessary for ski areas to be operated profitably. Both were reminding conference participants(area owners, managers and Forest Service personnel) that running a profitable ski area is, under even the best of circumstances, a difficult proposition. Industry statistics certainly bear this out.
The first study of ski area economics was conducted by Ted Farwell, then with Sno-Engineering. This study, reporting data from areas for the 1965-66 season, revealed an economic picture that was not only delicate, but rather discouraging. Next, NSAA commissioned Case & Company of New York to do a study of the industry for the 1967-68 season. This study, published in 1971, reported data furnished by 105 areas. By 1967-68 the industry’s economic picture had improved but looked anything but healthy.
Although the benchmark information provided in these studies was useful, there was no continuity and the information was, to some extent, dissimilar. Early in 1971, Copper Mountain’s Chuck Lewis (then head of NSAA’s Economic Study Committee) approached United Bank of Denver about the possibility of conducting an annual economic study of the industry. He correctly reasoned that as long as the bank was financing many of Colorado’s major ski areas, it should be interested in developing statistical data on the industry that the financial community would find useful. Hence, United Bank’s sponsorship of NSAA’s annual economic study, which has yielded two studies, starting with the 1970-71 season.
Several problems have been encountered in developing usable economic and financial statistics on the industry. First, although virtually all of the large ski areas are NSAA members, almost half of all areas in the United States are not members. Hence bias both in terms of limited industry coverage and inadequate coverage of smaller areas. Second, a relatively small percentage of NSAA members are able or willing to provide the data necessary for a thorough economic analysis of the industry. It should also be noted that additional bias is encountered via the disproportionately high response from large NSAA member areas that are better able to respond to the survey. In addition, accounting methods and record keeping vary widely from area to area thus making comparisons doubly difficult. Finally, ski areas are characterized by significant differences in scope and type of operation. For example, one area may have the capacity to handle 200,000 skiers annually while another can handle two million. Or one area might have a ski school, ski shop, rentals, restaurant and lodging facilities in addition to its lift operations while another may have only a lift operation. The problems inherent in comparing such disparate operations are obvious.
What do the statistics we have gathered thus far tell us about the economic health of the industry? A comparison between the 1967-68 and the 1971-72 data shows that the industry has grown and matured rapidly during this five-year period.
First, the income statements demonstrate that average area revenue from all operations has tripled. Direct expenses as a percentage of income has dropped from 59 to 47 percent during this five-year period. Correspondingly, gross margin has risen from 41 to 53 percent. Other expenses have also been reduced, from 40 to 38 percent, leaving an average pre-tax profit in 1971-72 of 15 percent compared with 1 percent in 1967-68. Two factors are significant here. Areas have been able able to generate additional revenues through some combination of growth in skier days, higher ticket prices and/or additional amenities for the skier, such as instruction, rentals, food, lodging and even merchandise. While increasing income, areas have been able to maintain control over expenses thus realizing economies of scale and increased profits in their operations.
Average area balance sheets reveal the same sort of change evidenced in the income statements. Total assets almost tripled during the five years from $745,000 to $2,008,000. Current assets as a percentage of total assets increased from 13 percent in 1967-68 to 19 percent in 1971-72 demonstrating increased liquidity. Although the capital structure has not changed radically, it is significant to note that, on a percentage basis, long term debt has been reduced and invested capital has decreased as retained earnings jumped from 2 percent of liabilities and net worth in 1967-68 to 12 percent in 1971-72. These findings indicate that the average area has greatly increased its scope of operation and has been able to finance some of its expansion through earnings.

| 1971-72 Season | 1971-72 Percent | 1967-68 Season | 1967-68 Percent | |
|---|---|---|---|---|
| Income | $1054 | 100.0% | $ 338 | 100.0% |
| Direct Labor | 238 | 22.6 | 95 | 28.1 |
| Other direct expenses | 263 | 24.9 | 105 | 31.1 |
| Total direct expense | $ 501 | 47.5% | $ 200 | 59.2% |
| Gross Margin | $ 553 | 52.5% | $ 138 | 40.8% |
| Other Expenses | ||||
| General and Administrative | $ 103 | 9.8% | ||
| Advertising | 41 | 3.9 | $ 52 | 15.4% |
| Insurance Liability | 24 | 2.3 | ||
| Forest Service Fees | 14 | 1.3 | ||
| Private Land Rental | 4 | .4 | 17 | 5.0 |
| Property Taxes | 18 | 1.7 | ||
| Interest | 53 | 5.0 | 20 | 5.9% |
| Depreciation | 98 | 9.3 | 45 | 13.3 |
| Miscellaneous Expense | 43 | 4.1 | ||
| Total Other | $ 398 | 37.7% | $ 134 | 39.6% |
| Pre-Tax Profit (Loss) | $ 155 | 14.7% | $ 4 | 1.2% |
| BASE | (83) | (105) |
There are numerous ways to measure financial performance. Some of these are reflected in the income statement and balance sheet comparisons above. But the comparative financial ratios provide an even better perspective on the economics of the industry. All ratios show improvement over the five year period, but the return ratios are particularly revealing. Return on equity increased from 2 percent to 21 percent during the period, while return on gross fixed assets jumped from less than 1 percent to almost 9 percent. The financial community was also gratified to see the number of times the average area earned its interest also increased significantly during a period when interest rates were rising rapidly.
| 1971-72 Season | 1971-72 Percent | 1967-68 Season | 1967-68 Percent | |
|---|---|---|---|---|
| Assets | ||||
| Current Assets | $ 373 | 18.6% | $ 95 | 12.7% |
| Gross Fixed Assets | 1791 | 89.2 | 583 | 78.3 |
| Less Depreciation | (526) | (26.2) | ||
| Other Assets | 370 | 18.4 | 67 | 9.0 |
| Total Assets | $2008 | 100.0% | $745 | 100.0% |
| Liabilities and Net Worth | ||||
| Current Liabilities | $ 386 | 19.3% | $ 162 | 21.7% |
| Long Term Senior Debt. | 549 | 27.3 | 339 | 45.5 |
| Long Term Subordinated Debt | 275 | 13.7 | ||
| Other Liabilities | 74 | 3.7 | ||
| Invested Capital | 491 | 24.5 | 230 | 30.9 |
| Retained Earnings | 233 | 11.6 | 14 | 1.9 |
| Total Liabilities and Net Worth | $2008 | 100.0% | $745 | 100.0% |
| BASE | (83) | (105) |
While these average area statistics demonstrate the dramatic improvement in the economic health of the industry, they do not reflect the differences among areas. For example, during the 1971-72 season 29 percent of the reporting areas lost money while 36 percent had profits in excess of $100,000. Interestingly, many of the more profitable areas were among the smallest as measured by traditional industry measures such as verticle transport feet/hour or gross fixed assets. As industry data developed thus far suggests, there are critical industry variables but they are not critical by themselves.
In my remarks to the National Winter Sports Symposium, I suggested some minimums necessary for an area to operate at a profit given the capital requirements of the industry. But it is even more important to emphasize that these minimums must be in balance with one another to effect a proper scale of operation. When the figures get out of balance, the operator is faced with either an unprofitable operation or one that may be profitable but is not operating efficiently, neither of which represents a desirable situation. Perhaps this is most graphically illustrated by the breakeven analysis for the industry that Ted Farwell constructed recently based on data for the 1971-72 season.
| 1971-72 Season | 1967-68 Season | |
|---|---|---|
| Cash Flow | $324,000 | $69,000 |
| Working Capital | ($13,000) | ($66,900) |
| Current Ratio | .97:1 | .59:1 |
| Equity Ratio | 36.0 | 32.8 |
| Debt to Equity Ratio | 113.8% | 138.5% |
| Number of Times Interest Earned | 6.1 | 3.5 |
| Return of Equity | 21.4% | 1.8% |
| Return on Gross Fixed Assets | 8.6% | .9% |
| Return on Total Capital | 7.7% | .5% |
| BASE | (81) | (105) |
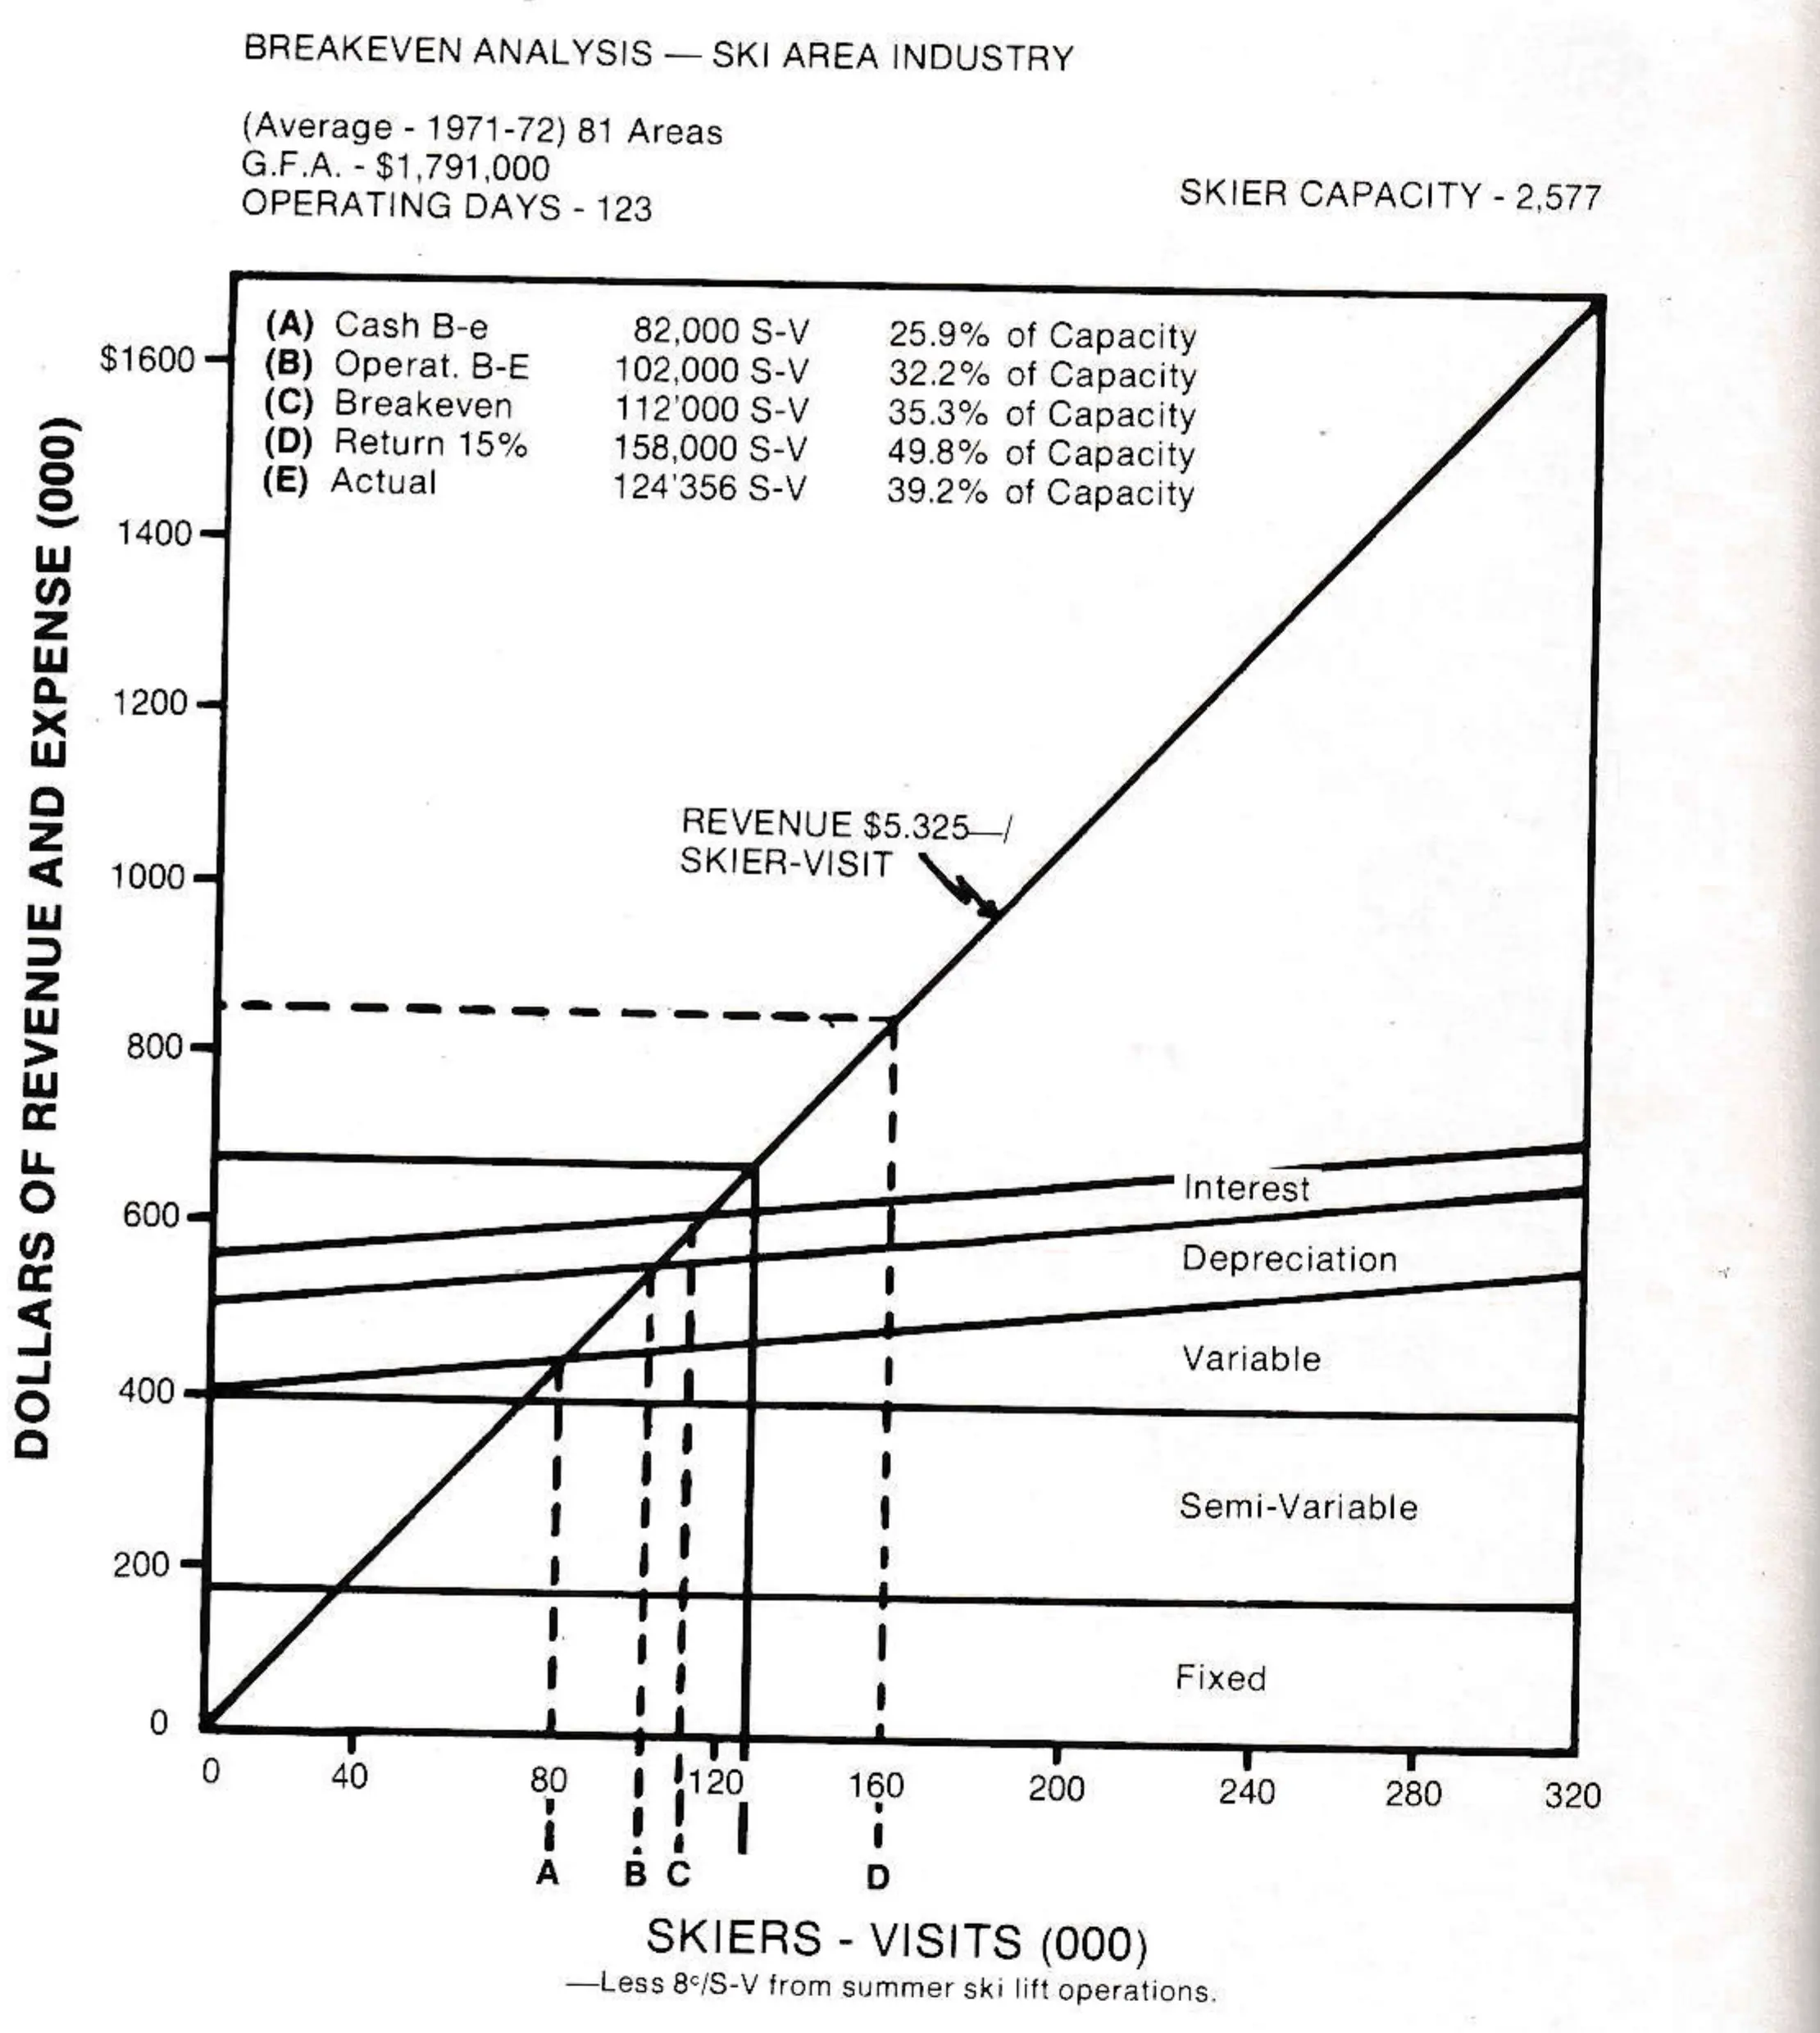
To summarize, the economic health of the industry is improving rapidly, but it is not improving uniformly. Many areas, particularly the smaller ones, are not sharing in the industry’s growth and prosperity. Obviously the most critical of many variables in the entire equation is management. For it has the responsibility of effecting a balanced operation consistent with the market it is serving. Fortunately, ski areas are now attracting more professional managers who are adequately prepared to deal with the “delicate” economics of the industry. Not all ski areas will be profitable. Not all will survive. But under good management those that develop proper internal balance and generate adequate demand can become profitable.