If more than 20 per cent of your regular customers arrived at your ski area in a spaceship, would you provide spaceship parking facilities or would you tell them to ski elsewhere? Such a decision might depend on whether or not you happen to like spaceship “types.” From a business viewpoint, however, you would have to measure the additional revenues these customers would generate against the extra cost of providing the parking space.
In a study conducted this past winter at 10 ski areas in Maine, Massachusetts, New Hampshire and Vermont, over 20 per cent of the skiers interviewed brought all or part of their lunch with them. Yet the facilities provided for brownbaggers at many ski areas rival the parking lots for spaceships. They are non-existent.
For study purposes, the sample ski areas were broken into two groups — Type A or smaller areas and Type B or larger areas. A Type A area had less than 1,200-ft. vertical drop, was located within 40 miles of a population center of 50,000 people, had less than 100 rentable beds in the immediate area and a capacity of less than 1,400 skiers per day. The Type B or larger areas were characterized this way — more than 1,600-ft. vertical drop, more than 60 miles from a population center of 50,000, more than 200 rentable beds in the immediate area and a capacity of over 2,000 skiers per day.
Some key points that surfaced in the study were:
- Over 60 per cent of the brownbaggers ski on an all-day ticket and another 31 per cent on a season pass of one sort or another.
- Of those on their first ski outing of the season, 18 per cent brought their own lunch. In other words, they had not even given the cafeteria a try.
- Smaller Type A areas have a hard-core brownbag market which is a fixed part of the operation and stands little chance of being lured into purchasing a full lunch.
- Brownbaggers at smaller areas spend over 50 cents each in the cafeteria.
- Larger Type B areas have marginal brownbaggers who could go either way (hard-core or full-lunch), depending on whether they feel cafeteria prices are too high or the facilities are too crowded.
- Type B areas have a definite opportunity to convert brownbaggers into full-lunch buyers.
- Price is the single most important factor determining whether skiers brownbag at either Type A or Type B areas. And price means the total daily expenditure, not just food costs.
One of the assumptions of the study was that the home-run ball in ski area operations is the all-day ticket, and to sell that ticket, the operator must provide other prodducts and services to attract skiers. These products and services are divided into revenue-producing and non-revenue-producing departments for accounting purposes. The revenue-producing departments are expected to contribute an acceptable per cent to gross revenues. One such center is, of course, skier feeding.
The study points out that a sizable number of lift tickets are bought by skiers who, for one reason or another, bring a lunch. Further, many brownbaggers would ski at another area if lunches were forbidden. Also, brownbaggers can have a definite positive effect on revenue from feeding operations if there is a capacity to serve them adequately.
A problem arises when skier demand so exceeds the capacity of the lodge facilities that it results in diminishing returns from food service operation. Quite reasonably, an operator wants to provide a customer who has spent money on a full lunch with a place to eat that lunch. Understandably, the desire to provide a seat for a customer who has purchased only half his lunch is not as great, since the operator needs two half-lunch customers to get a similar return. In this respect, the study found that the brownbagger who brings an all-inclusive lunch is clearly persona non grata. In effect, the operator tells him that he wants him to buy an all-day lift ticket, but he does not want him to take up eating space.
Data suggest that area operators should find ways to provide more space for brownbaggers if they plan to serve these demands and achieve higher profit levels overall. Also, ski area planners should recognize that brownbaggers are a fact of life and cannot be designed out of an area by ignoring necessary storage and seating space. By providing this space and the facilities for the brownbagger to purchase lunch adjuncts, 20 per cent of the market is being told, “We want your business. Come back and ski again sometime.”
A close look at the brownbagger showed that he is not much different from other skiers. He skis an average of 9.78 days a year, although many brownbaggers ski less than five days a year. He travels an average of 48.77 miles to visit Type A smaller areas and 204.45 miles to visit Type B larger areas. He invariably arrives before noon and is most likely to have an all-day ticket. If he has a season pass, it is usually at a smaller area. He most likely skis with his family, but can generally be found with any group, especially if there are children in the group.
In short, the brownbagger can rightfully be accused of creating problems in an area cafeteria, but he is a considerable, positive, economic influence on profit levels.
At smaller areas
The most important aspect of brownbagging at smaller areas is the fact that 95 per cent of the brownbaggers use this type of area. This is nearly twice that of larger Type B area. They also brownbag either every visit or just on weekends. This hard-core brownbag market is a fixed part of the operation at smaller areas and not marginal in the sense that they could be lured into buying their lunch.
The fact that a group contains children increases the probability that the group will be brownbagging. There is no significant difference, however, between small and large areas in this respect. What is significant about small areas is that brownbaggers bring their lunch to complement the food service operation. They bring their lunch, but they also buy part of it at the area. Not tabulated here, but in a follow-up study, it was found the average spending by brownbagging families was 54.3 cents/visit/person.
From this it would seem logical that because the brownbaggers at smaller areas are hard-core, improved cafeteria merchandising will have little effect in luring them into buying full lunches. However, these smaller areas could capitalize on their brownbag market by offering more lunch adjuncts, since most brownbaggers do spend some money to supplement their picnic lunches.
At larger areas
Larger areas are characterized by a marginal eating facility user who might decide to brownbag if he feels that prices are too high or if he thinks the facilities are too crowded. These brownbaggers substitute their lunch for the food sold by the cafeteria and are more likely to bring an all-inclusive lunch.
It is interesting that skiers who had travelled great distances (800 miles in some cases) apparently on vacations also had a picnic lunch. These individuals shop in a nearby town and were observed making their lunch at the area.
One reason the percentage of brownbagging is less at larger Type B areas is that the hard-core brownbagger from the smaller area only shows up at the Type B area occasionally. He might ski at his local area for four or five weekends before he spends a weekend at a larger area. Paradoxically, the hard-core brownbagger, if he is going to skip a day of brownbagging and “do it right,” is going to skip when he is at Type B area and not at a Type A.
It appears that the larger areas have the opportunity to convert marginal brownbaggers into lunch buyers, if they can make purchasing food easier and provide adequate seating. There is no indication that restrictive policies help convert marginal brownbaggers. The study suggests that such policies could send brownbaggers and their potential lift ticket revenue to other ski areas.
By using the mean lift ticket price for each type of area as an index, it was possible to correlate ticket price to the per cent brownbagging (Table I). This is admittedly a simplistic model and does not account for other per/visit expenditures such as gasoline, tolls, lodging and miscellaneous expenses. The high correlation, however, suggests that the lift ticket price is the single most important factor in affecting cafeteria demand.
| Area | Cafeteria Reference Price (¢) | Lift Index Factor | Adjusted price (¢) | Number of brownbaggers (%) |
|---|---|---|---|---|
| A-1 | 37.50 | 0.758 | 28.4 | 26.09 |
| A-2 | 40.00 | 0.758 | 30.8 | 30.00 |
| A-3 | 50.00 | 1.061 | 53.1 | 32.25 |
| A-4 | 57.50 | 1.061 | 61.0 | 36.84 |
| A-5 | 50.00 | 1.355 | 67.9 | 33.33 |
| B-1 | 58.33 | 0.872 | 50.9 | 18.46 |
| B-2 | 63.33 | 0.930 | 58.8 | 22.85 |
| B-3 | 59.16 | 1.102 | 65.4 | 25.35 |
| B-4 | 60.00 | 1.102 | 66.4 | 22.00 |
| B-5 | 74.17 | 0.989 | 73.2 | 27.14 |
| Type of ticket | Type A area (%) | Type B area (%) | Total sample (%) |
|---|---|---|---|
| All-day | 44.73 | 71.05 | 62.28 |
| Half-day | 7.89 | 2.63 | 4.38 |
| Special* | — | 2.63 | 1.75 |
| Season (single) | 2.63 | 10.52 | 7.89 |
| Season (family) | 44.73 | 13.15 | 23.68 |
| Response | Type A area (%) | Type B area (%) | Total sample (%) |
|---|---|---|---|
| Nothing | 21.34 | 30.12 | 28.60 |
| Good food | 17.99 | 27.56 | 25.82 |
| Fast service | 21.34 | 14.10 | 15.94 |
| Congenial atmosphere | 8.98 | 10.57 | 10.37 |
| Reasonable prices | 14.60 | 2.24 | 5.06 |
| Physical layout | — | 4.18 | 3.29 |
| Bar | — | 3.85 | 3.03 |
| Not crowded | 5.60 | 1.92 | 2.78 |
| Friendly service | 2.24 | 2.56 | 2.53 |
| Cleanliness | 7.86 | 0.97 | 2.53 |
| Response | Type A area (%) | Type B area (%) | Total sample (%) |
|---|---|---|---|
| Nothing | 32.15 | 47.22 | 43.51 |
| Congenial atmosphere | 14.28 | 15.27 | 14.81 |
| Good food | 10.71 | 13.88 | 12.96 |
| Fast service | 17.85 | 8.33 | 11.11 |
| Not crowded | 14.28 | 2.77 | 6.48 |
| Cleanliness | 7.14 | 1.38 | 2.77 |
| Bar | — | 4.16 | 2.77 |
| Reasonable prices | 3.57 | 1.38 | 1.85 |
| Friendly service | — | 2.77 | 1.85 |
| Physical layout | — | 2.77 | 1.85 |
| Response | Type A area (%) | Type B area (%) | Total sample (%) |
|---|---|---|---|
| Nothing | 50.42 | 28.52 | 34.42 |
| Prices | 18.48 | 29.75 | 26.69 |
| Crowded | 0.84 | 11.65 | 8.72 |
| Food quality | 5.04 | 8.89 | 7.84 |
| Slow lines | 2.52 | 8.28 | 6.72 |
| Variety | 10.92 | 3.37 | 5.40 |
| Facilities | 5.88 | 2.45 | 3.36 |
| Atmosphere | 3.36 | 3.06 | 3.13 |
| Cleanliness | 2.52 | 2.45 | 2.56 |
| Everything | — | 1.53 | 1.11 |
| Response | Type A area (%) | Type B area (%) | Total sample (%) |
|---|---|---|---|
| Price | 26.98 | 45.83 | 39.68 |
| Nothing | 42.85 | 26.39 | 31.96 |
| Crowded | 1.58 | 12.50 | 8.89 |
| Food quality | 6.34 | 5.56 | 5.83 |
| Facilities | 6.34 | — | 2.11 |
| Slow lines | 4.76 | 4.16 | 4.36 |
| Variety | 6.34 | 1.39 | 3.04 |
| Cleanliness | 3.17 | 2.78 | 2.91 |
| Atmosphere | 1.58 | 1.39 | 1.45 |
| Everything | — | — | — |
| Type A area (%) | Type B area (%) | Total sample (%) | |
|---|---|---|---|
| Had picnic lunch | 31.40 | 23.30 | 25.50 |
| Sometimes bring picnic lunch | 33.05 | 40.18 | 38.25 |
The role of the lift ticket in determining cafeteria demand is important for area operators. It means that lift ticket and cafeteria prices must be considered as a unit when price changes are planned, because the study indicates that if the ticket price is comparatively high, cafeteria prices should be comparatively low for optimal cafeteria usage. The opposite is equally true, that is, if the all-day ticket price is relatively low, the operator can safely charge more for food without increasing the number of brownbaggers.
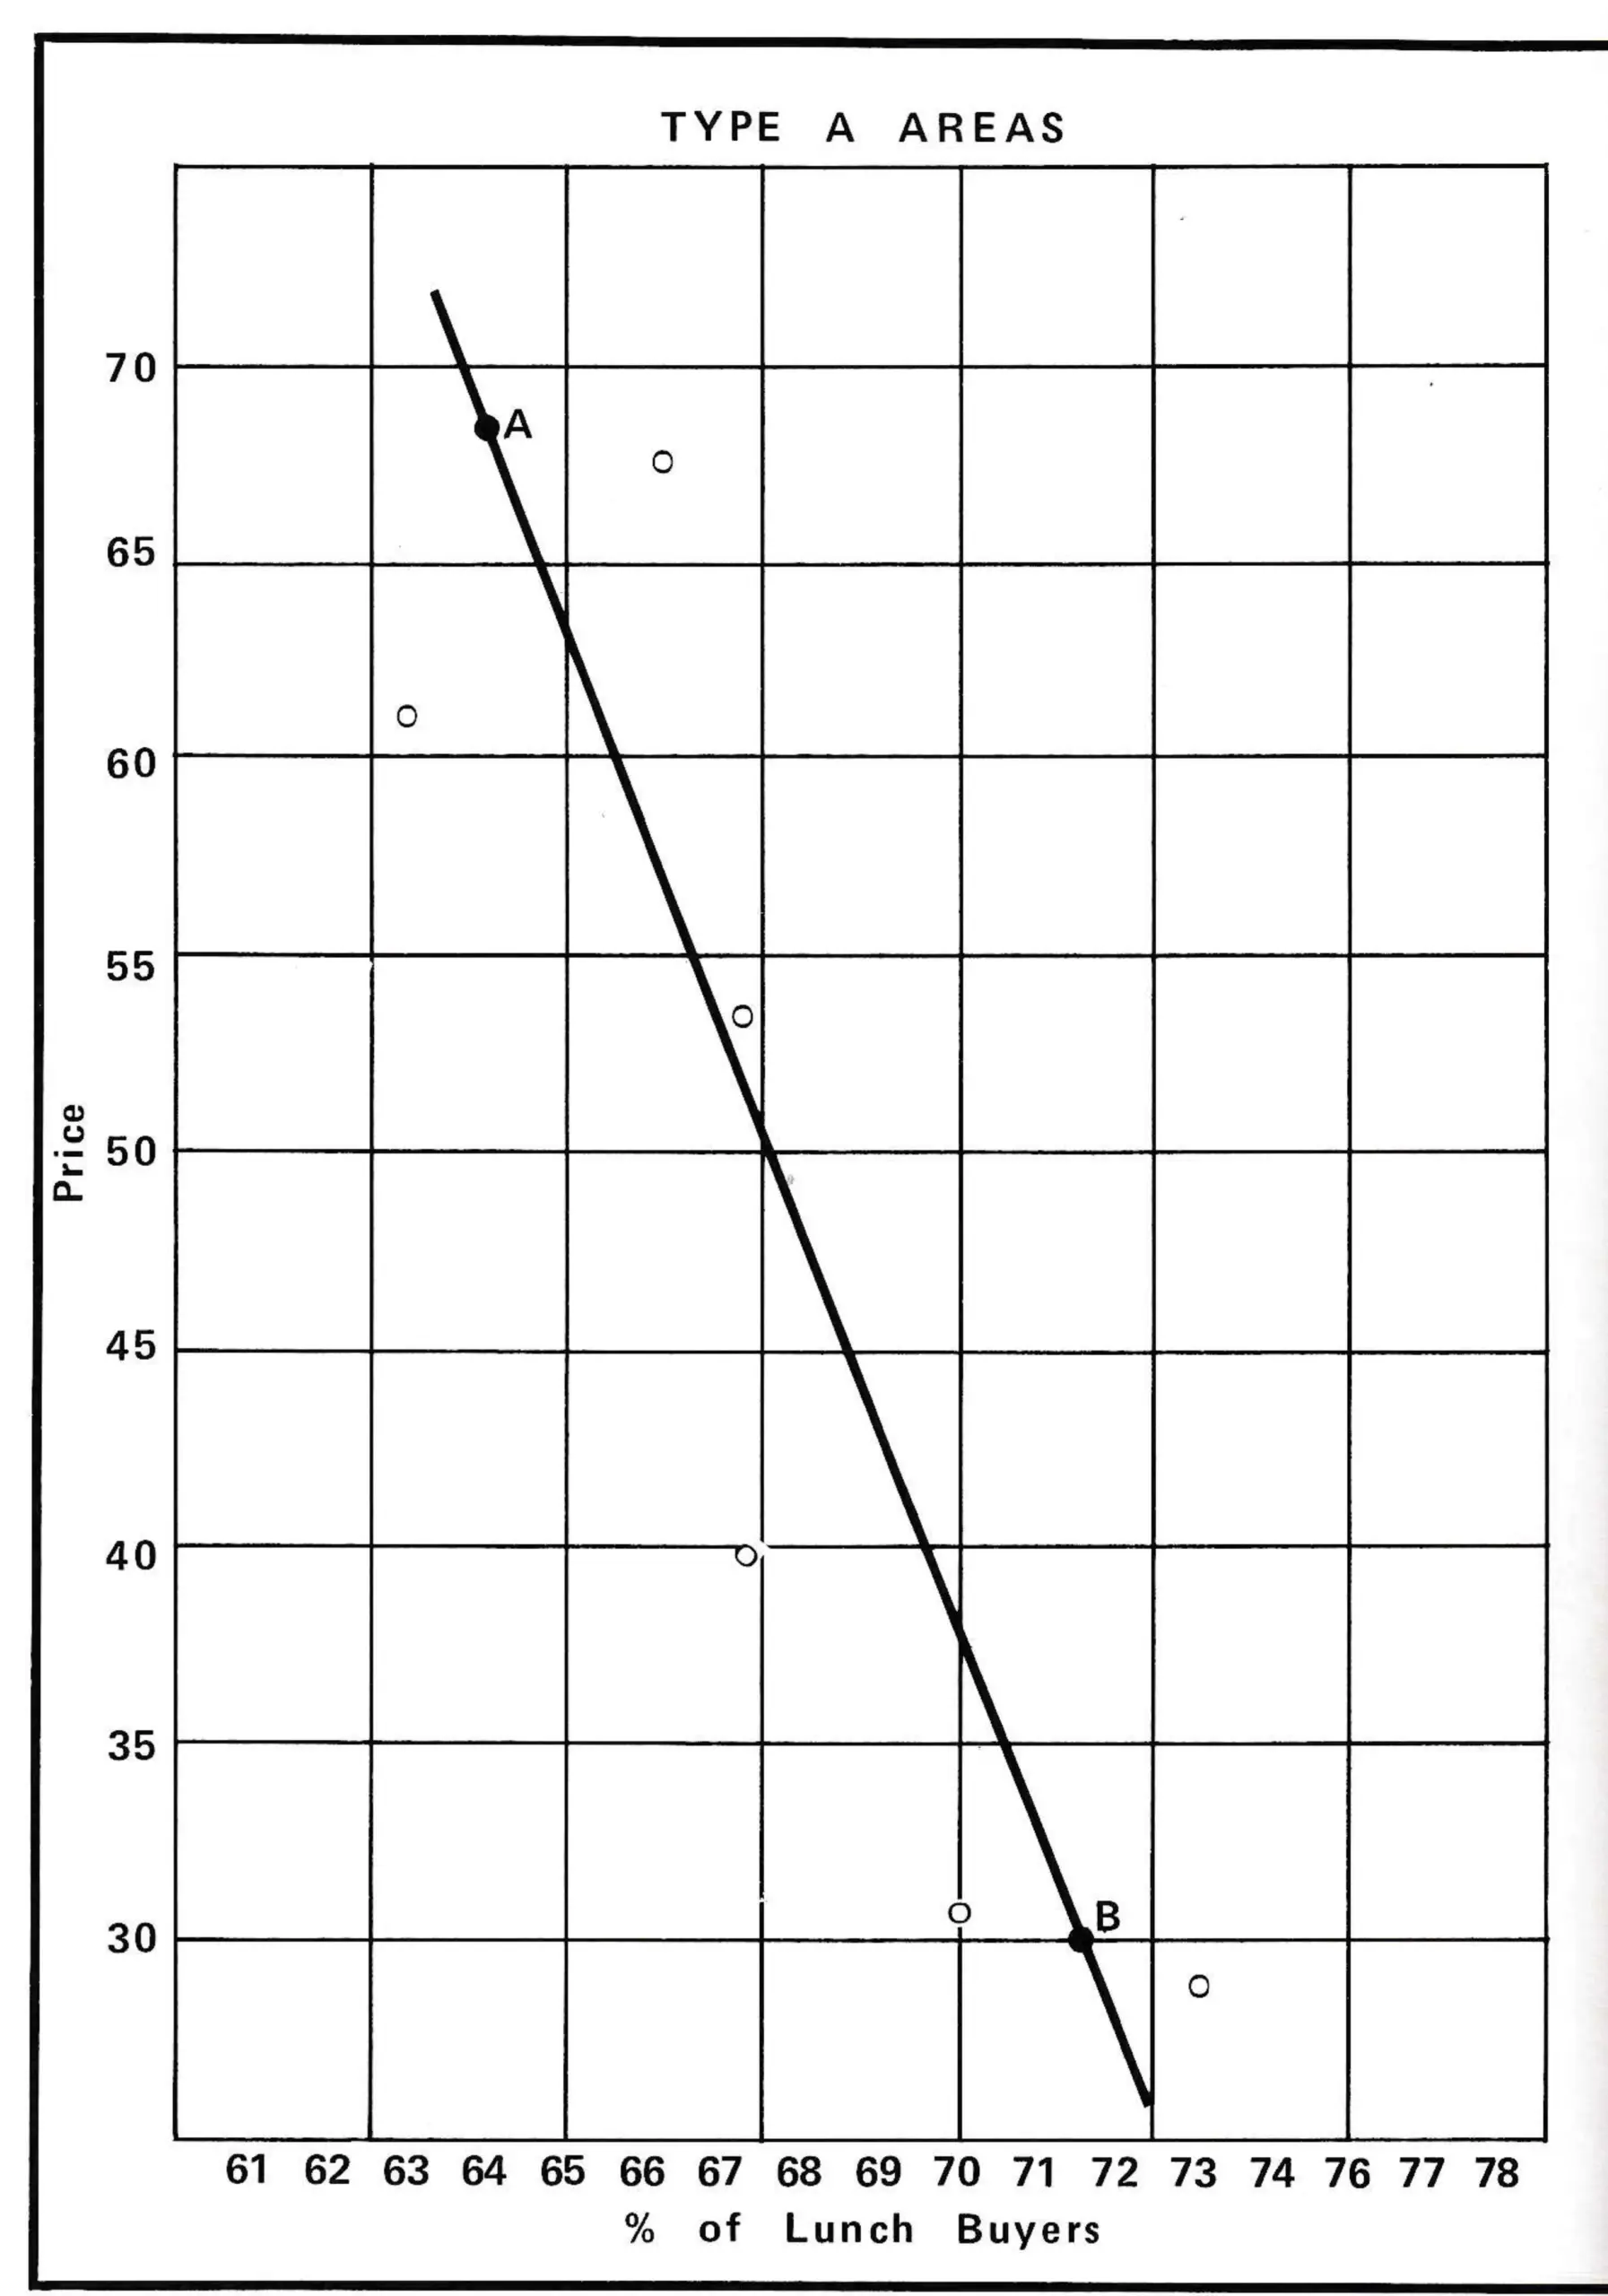
To investigate optimal prices for cafeterias, the percentage of brownbaggers was subtracted from 100 per cent. In other words, total skiers, minus brownbaggers, equals those who eat in the cafeteria. This percentage was then plotted as a straight line against prices to determine a demand curve for both types of areas (Figs. 1 and 2).
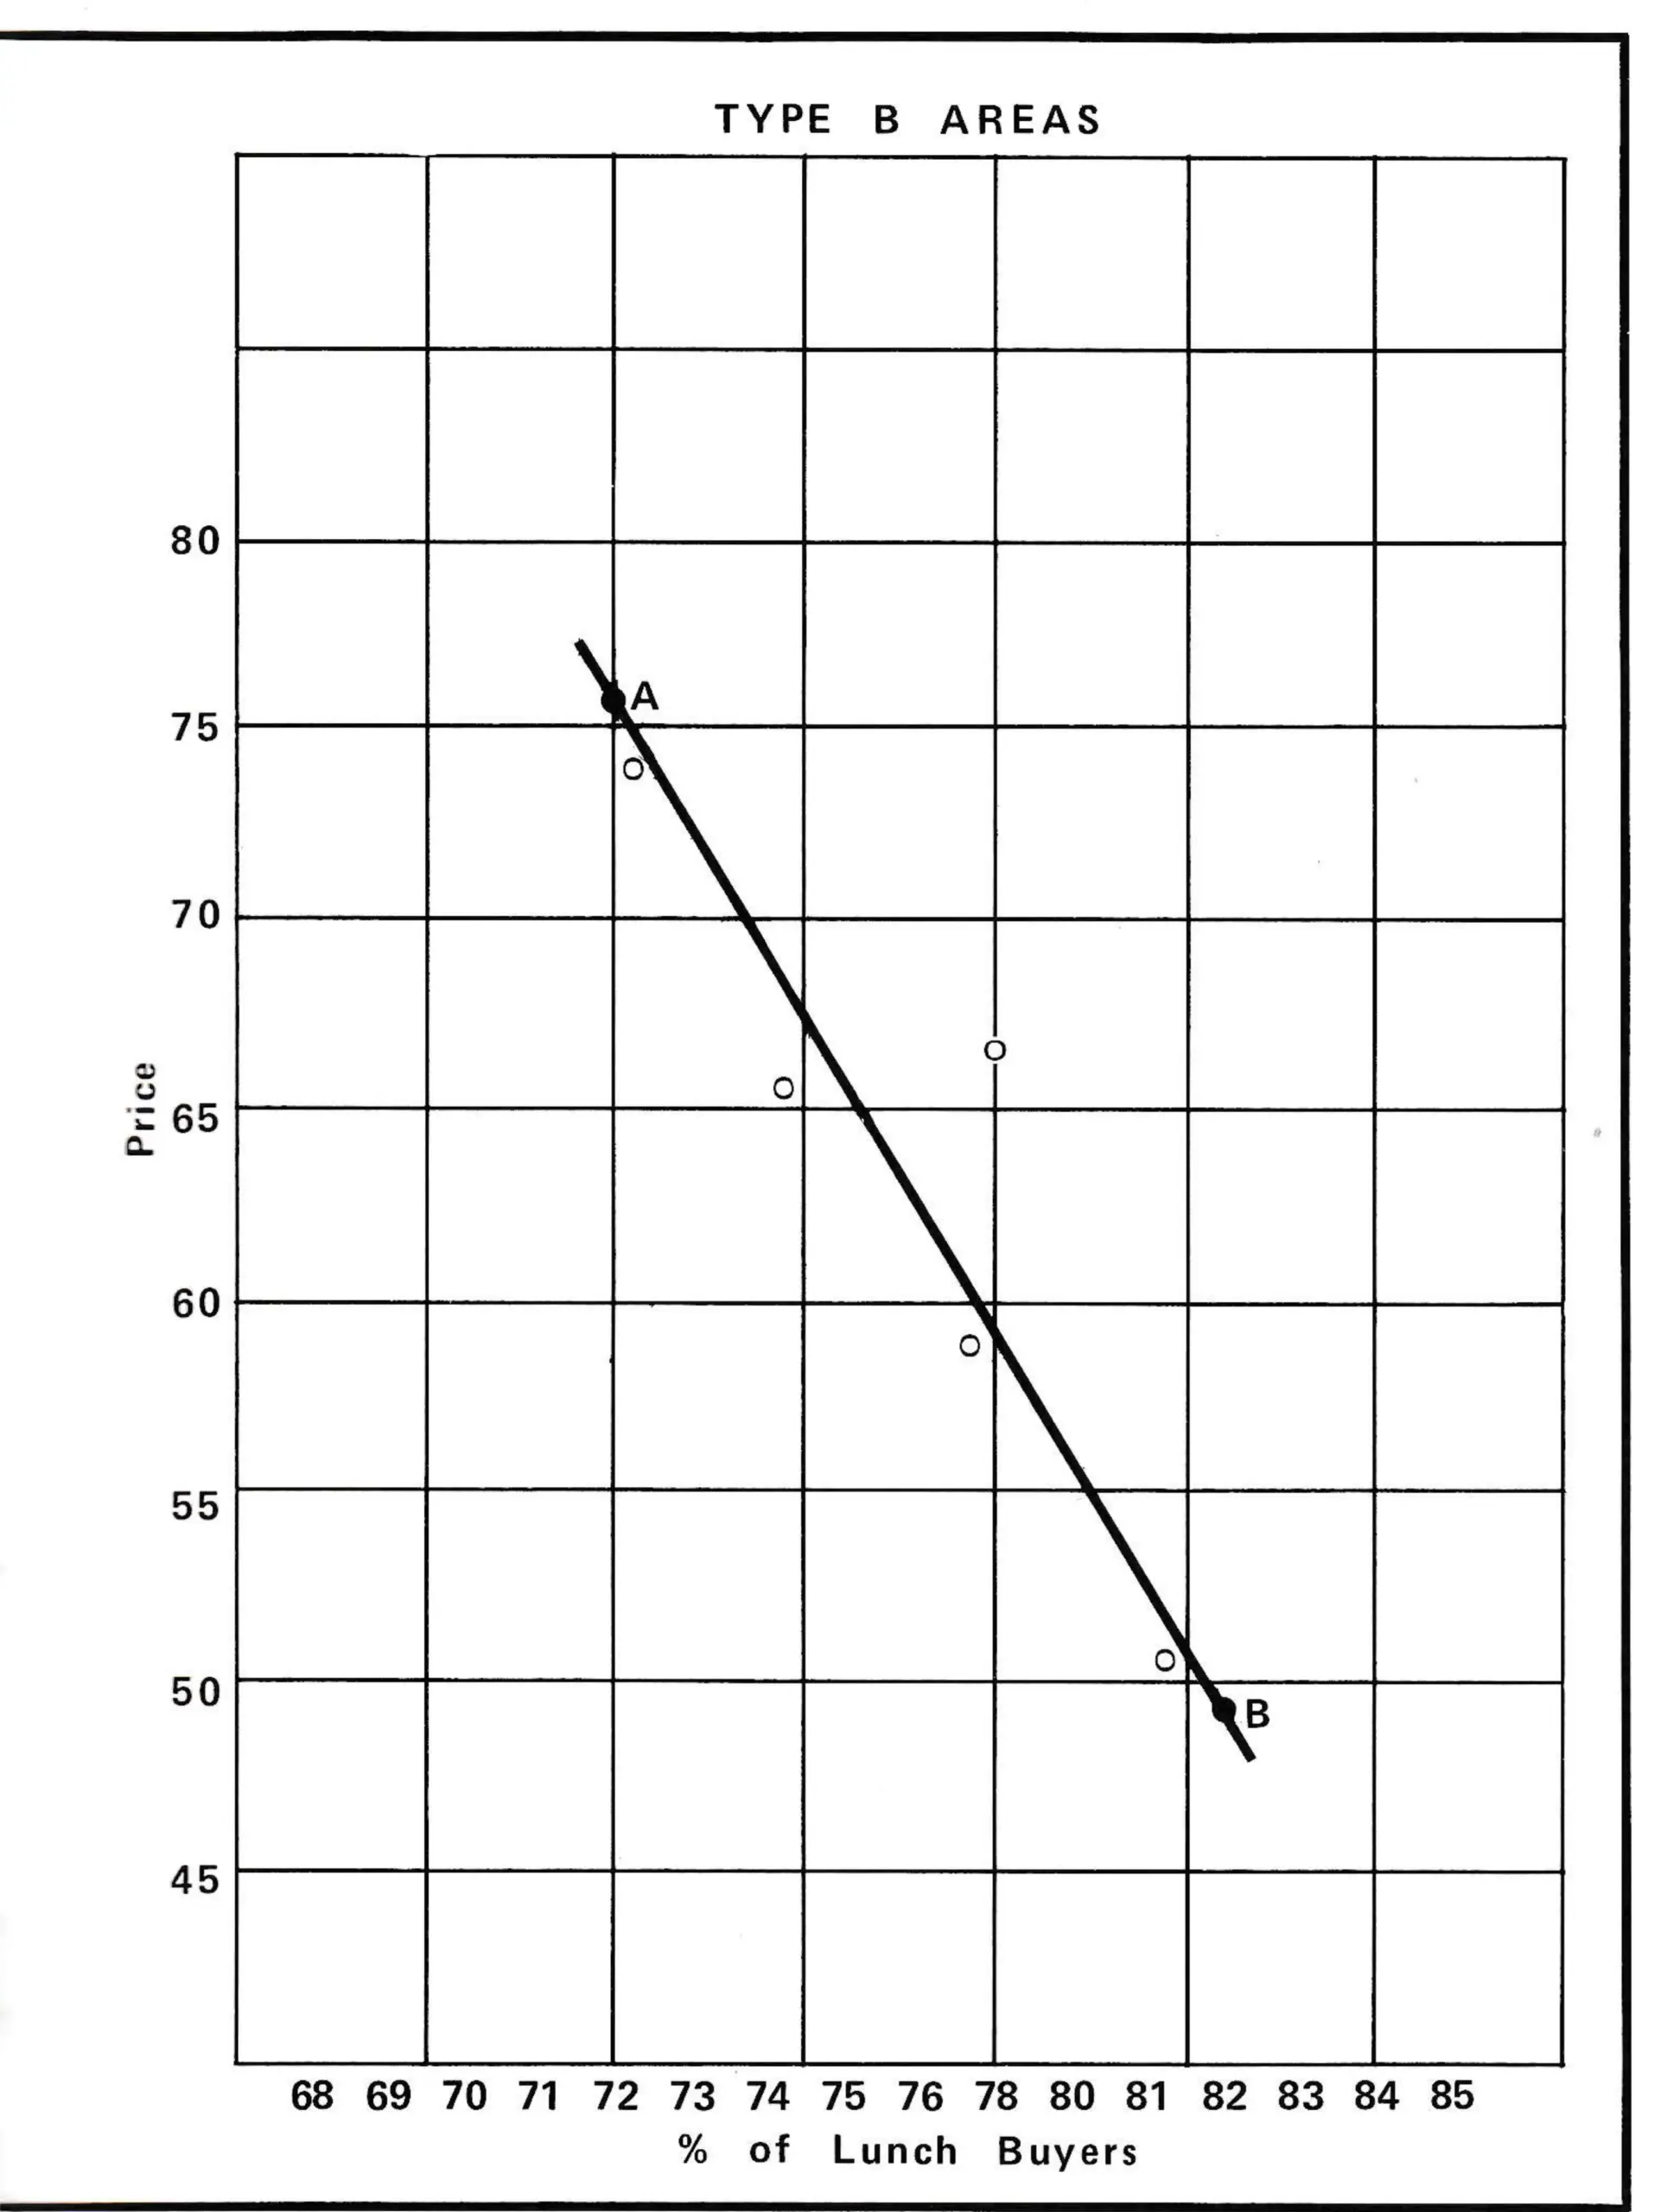
The resulting demand curves proved to be downward sloping and relatively inelastic. In other words, ski areas could conceivably generate more revenue by increasing prices without a corresponding increase in the number of brownbaggers. For example, an area which now serves 520 meals to 800 skiers might find that a price increase causes the number of people buying meals to drop to 480, but this would result in greater revenue. In this situation, increasing price from 60 cents to 75 cents would result in a revenue jump from $312 (60 cents × 520 meals) or a net increase in revenue of $48 (15 per cent). In effect, prices in this example have been increased 25 per cent, but revenue has dropped only 7.7 per cent. (If demand were perfectly elastic, the percentage increase in price would result in the exact same percentage decrease in meals served and revenue.) Of course, such a price move would have to be considered in the light of lift ticket prices, as explained earlier.
Naturally these pricing decisions cannot be made without also considering costs. If cafeteria output (meals served) is in a range of diminishing returns for capital and labor input (buying more equipment or adding employees does not result in a significant increase in output), raising prices would bring less volume but more profit. However, if this drop in output left some equipment idle or lowered the productivity of cafeteria employees, average total cost would increase, so increased revenue from higher prices might be eaten up by these higher average costs.
As a final point on price, this study is not suggesting that price in itself sets demand. Product quality, product differentiation, population densities, customer profiles and location are also significant. But, given a suitable marketing environment and an acceptable merchandising mix, it appears from the study that price is the single most important factor in keeping customers happy.

A copy of the full brownbagger study, entitled “The Brownbagger — Bane? Blessing?” is available from SKI AREA MANAGEMENT, 235 E. 45th St., New York, N.Y. 10017. Price $20.
Two Brownbag Case Studies
The Chicago Art Institute operates a 200-seat cafeteria for visitors to their museum, serving 1500 people a day, many coming in groups on chartered buses.
The cafeteria utilizes a series system with one cashier. It attempts to maximize revenues through effective merchandising display and depends upon a high check average for profitability.
Twenty-two years ago, when the state of Illinois first allowed school children to be bused to the museum, the institute recognized the need for separate food facilities. As the current food service director, Mrs. Shirley Frost points out, children need more room than adults in which to move around. To segregate children from adults, the institute converted a storage room into a lunch room. The room originally had painted walls, a tile floor, redwood picnic tables seating eight to a table, galvanized trash barrels. Food was not sold here.
The room did not satisfy the demand for lunch adjuncts such as beverages and dessert and it was not neat and orderly. It had to be policed to ensure compliance with self-busing rules and to prevent malicious damage. The unattractiveness of this picnic room caused congestion in the main cafeteria because many brownbaggers were having a coke or coffee with their sandwiches and refused to eat in the picnic area. The situation was reflected in declining cafeteria revenues and profits. To curb this and to provide better service, the picnic room was redecorated and a limited food counter was added.
The corridor wall was replaced with a “storefront” of glass panels with aluminum frames and a double swing door. The plastered walls had fixed panels mounted, covered with a burlap-type material and color coordinated in gold, beige and brown. These panels are used to display graphics which are the “key to the whole room,” according to Mrs. Frost. The redwood picnic tables were replaced by 25 five-place formica-top tables and waffle-weave wire chairs with tie-on cushions. The galvanized garbage cans were replaced by plastic push-top trash receptacles and a food counter was set up to dispense coffee, fruit punch, white and chocolate milk, ice cream and cookies. As a further inducement, the institute provided storage space for lunch baskets and bags in the room.
Mrs. Frost said patrons will require “gentle nudging” to enforce self-busing rules, but their overall attitude has improved. Behavior which might be described as hostile—refusing to bus tables, maliciously spilling refuse on the floor and table hogging—has sharply decreased with the new room.
Mrs. Frost explained that the room’s profitability depends on the number of hours operated and the proximity to additional snack markets. The average adult spends 35-40 cents in the picnic room while the children spend 13 cents based on the average volume of 350 customers a day.
There are some definite similarities between the Chicago Art Institute and a ski area base lodge. First of all, it would be rare to find a visitor at either facility whose primary purpose is to use the eating facility. But as in the hotel industry, where a hotel must maintain a coffee shop or restaurant to meet overall investment potential, a ski area must provide adequate food service also.
A Type B (larger) ski area in New England expanded and upgraded its brownbag facilities between the 1969-70 and 1970-71 seasons. Floor space and the number of windows were increased. Carpets were added and picnic tables were replaced with colonial-style furniture identical to that in the main cafeteria. The room has vending machines for hot drinks, cold drinks, soup and cigarettes, but not pastry or dessert items.
In a pre-season interview, the firm’s general manager indicated that “the brownbagger is an important customer and deserves equal treatment. I admit we have been guilty in the past of not providing adequate facilities, but now we have upgraded them. They now have facilities as good as our regular food customers.” The only differences are no fireplace in the brownbag area and the windows face the parking lot instead of the skiing activity.
The area’s biggest problem with brownbaggers is that they congest the seating area with their belongings. “They bring all their stuff and park it. They park it on a table and then go out to ski.” Coin operated lockers, available on the lower level, have not solved the problem.
Although food service revenue did increase, it is impossible to relate this to improvements in the brownbag area, since beer and wine were also added this season and skier days were ahead considerably. (1969-70 was a bad snow year at this area.) Food service revenues did not meet management’s projected increases and average skier-day spending in the base lodge dropped as the number of skier-days increased. This perhaps can be explained by the fact that demand often exceeded comfortable capacity by 132 per cent on weekends. It is likely that increased revenue from vending machines relates to the additional use of the brownbag room, but many variables prevent any reliable correlation between total food sales-profits and the improved brownbag room.
Littering is not a factor at this area because there are busboys. The food service director, although he did not share the general manager’s view that the brownbagger was an important customer, indicated that brownbaggers were no messier than regular customers. This response was surprising because food service directors at five other sample areas of comparable size were outrightly hostile toward brownbaggers and indicated that their littering was excessive.
The area’s general manager felt the brownbag room received much better use after it was upgraded. It did not, however, get full utilization until other cafeteria space was full. Finding additional eating space for weekends is still the biggest problem at this area.
There was no opportunity to measure attitude change in the brownbagger as a result of improvements in the eating area because all the sampling was done during the 1970-71 season. However, management did express the opinion that relations had improved.
This ski area situation supports the theory that improved facilities will improve usage. This in turn improves customer satisfaction and builds repeat business, in food, lift ticket and other revenue areas.