

Active skiers can easily burn up 700 calories an hour which makes him a psychologically and physiologically ready market for tempting pastry items. Since sales resistance is low and comparative shopping non-existent with these “blind” items (because the skier is not as aware of comparative prices on pastry items as he might be with hamburgers and coffee), it is imperative that the food service operation carry a money-making line of pastry. Whether the operator produces or buys his pastry, however, requires careful analysis.
Historical data should be analyzed first along with the pastry market and the product mix. Cost of the present method of supply should be compared to the alternatives. Best use of space and capital investment must also be considered. A new operator must project all of this data with considerable care. The expense of planning is low compared to the cost of making the wrong decision.
The operator must know the volume that pastry contributes to food sales to determine the value of pastry on the menu. Table I shows each menu classification expanded to show contribution to gross food sales. In this case, pastry contributed 9.19 per cent. Using this example, if food sales were $80,000, the pastry market would be $7,352. Before analyzing cost, however, the product mix that constitutes the pastry volume must be studied, because particular items do not contribute equally to the overall volume. Are doughnuts contributing significantly to pastry gross? Do combined sales of muffins and cupcakes warrant the investment in pastry tins? What would be the effect on the mix if these items were dropped? Would coffee sales suffer without doughnuts? Would the snack market be harmed without the variety afforded by cookies? With the mix determined and/or adjusted, cost analysis can begin.
ANALYSIS OF COST
At this point, the food manager should attack the analysis as a team effort, making sure that preconceived ideas do not stack the deck. A manager arguing for the sales value of goods baked on the premises can produce evidence to show a bigger and better bake shop is required, while a controller can prove the area should be renting skis out of the bake shop. Both of these factions should meet with an arbitrator who has no axe to grind.
To analyze costs, begin by identifying all costs associated with each item of the product mix, both for baking on the premises and buying from a supplier. These costs are apportioned over the entire season, then the total cost in each category is divided by the number of days in the season, in this case, 100 days.
In Table III, each element of the product mix has been analyzed for its comparative (bake or buy) cost: 1), ingredient cost—elements that make up the cost of goods sold; 2), disposable cost—paper plates, napkins, plastic forks, etc., that accompany the sale of each item; 3), equipment amortization — using 10-year-write-off, no salvage value; 4), power usage—only that power used in production or storage; 5), labor cost—labor which relates directly to the production, packaging and presentation of pastry items.
Even before considering interest on capital investment or the allocation of overhead, this operation would be better off buying pastry. At a volume of $7,352 (pastry for a hypothetical 300-seat cafeteria serving 900 skiers per day), the operator would save $1,272.90 by buying instead of baking. Would he still save this if pastry volume doubled?

Table IV indicates that he would still save, but not nearly as much. It costs about the same to run a refrigerator that is only half filled as one that is full, so many of the costs of baking at Volume A remain fairly constant for Volume B. The savings at Volume A dwindles to $122.40 in Volume B.
BEST USE OF SPACE AND RETURN ON INVESTMENT
The operator must also ask himself, “Can I use that same space for some more productive purpose?” and “Can I use my investment capital for a more productive purpose?” The fixed cost, which would be incurred whether the area is doing business or not, is allocated on a square footage basis, i.e. total fixed cost is divided by square footage. This assumes that all space is equally valuable regardless of its use, and that’s the rub! Operators recognize that dissimilar use makes some space more valuable. The example in this column uses a common cost approach pegging space at $2.10/sq. ft.
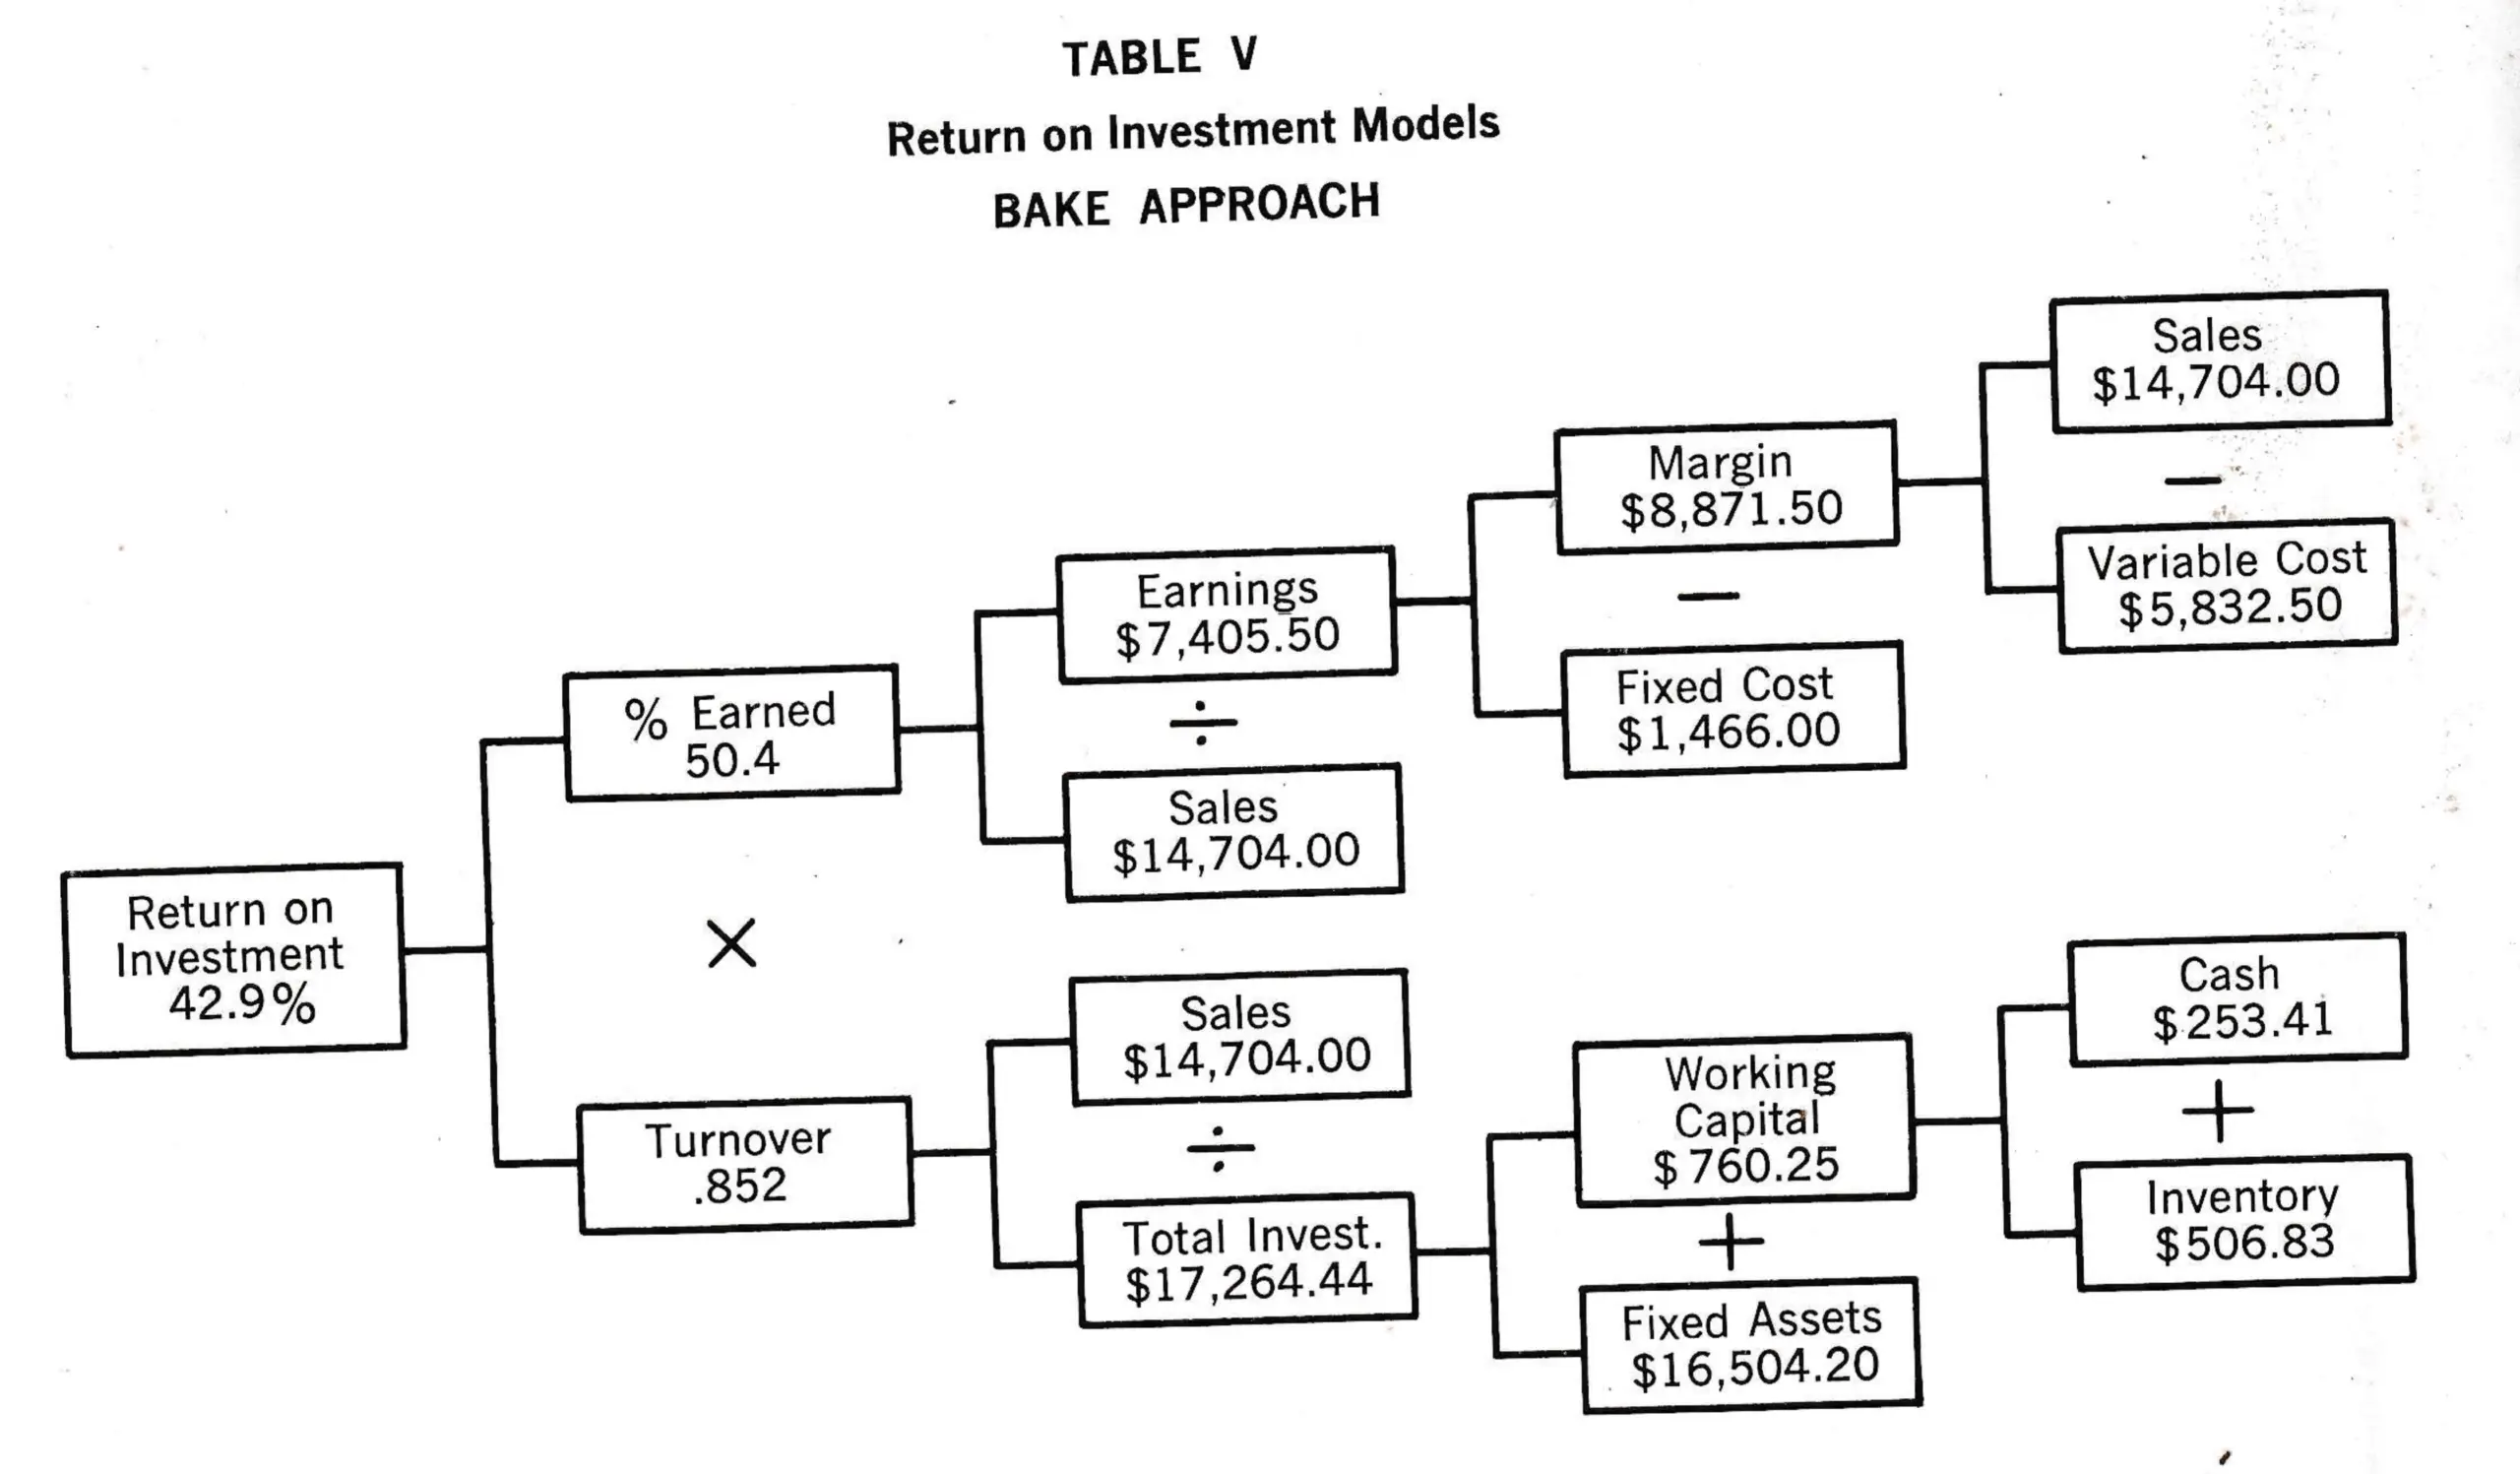
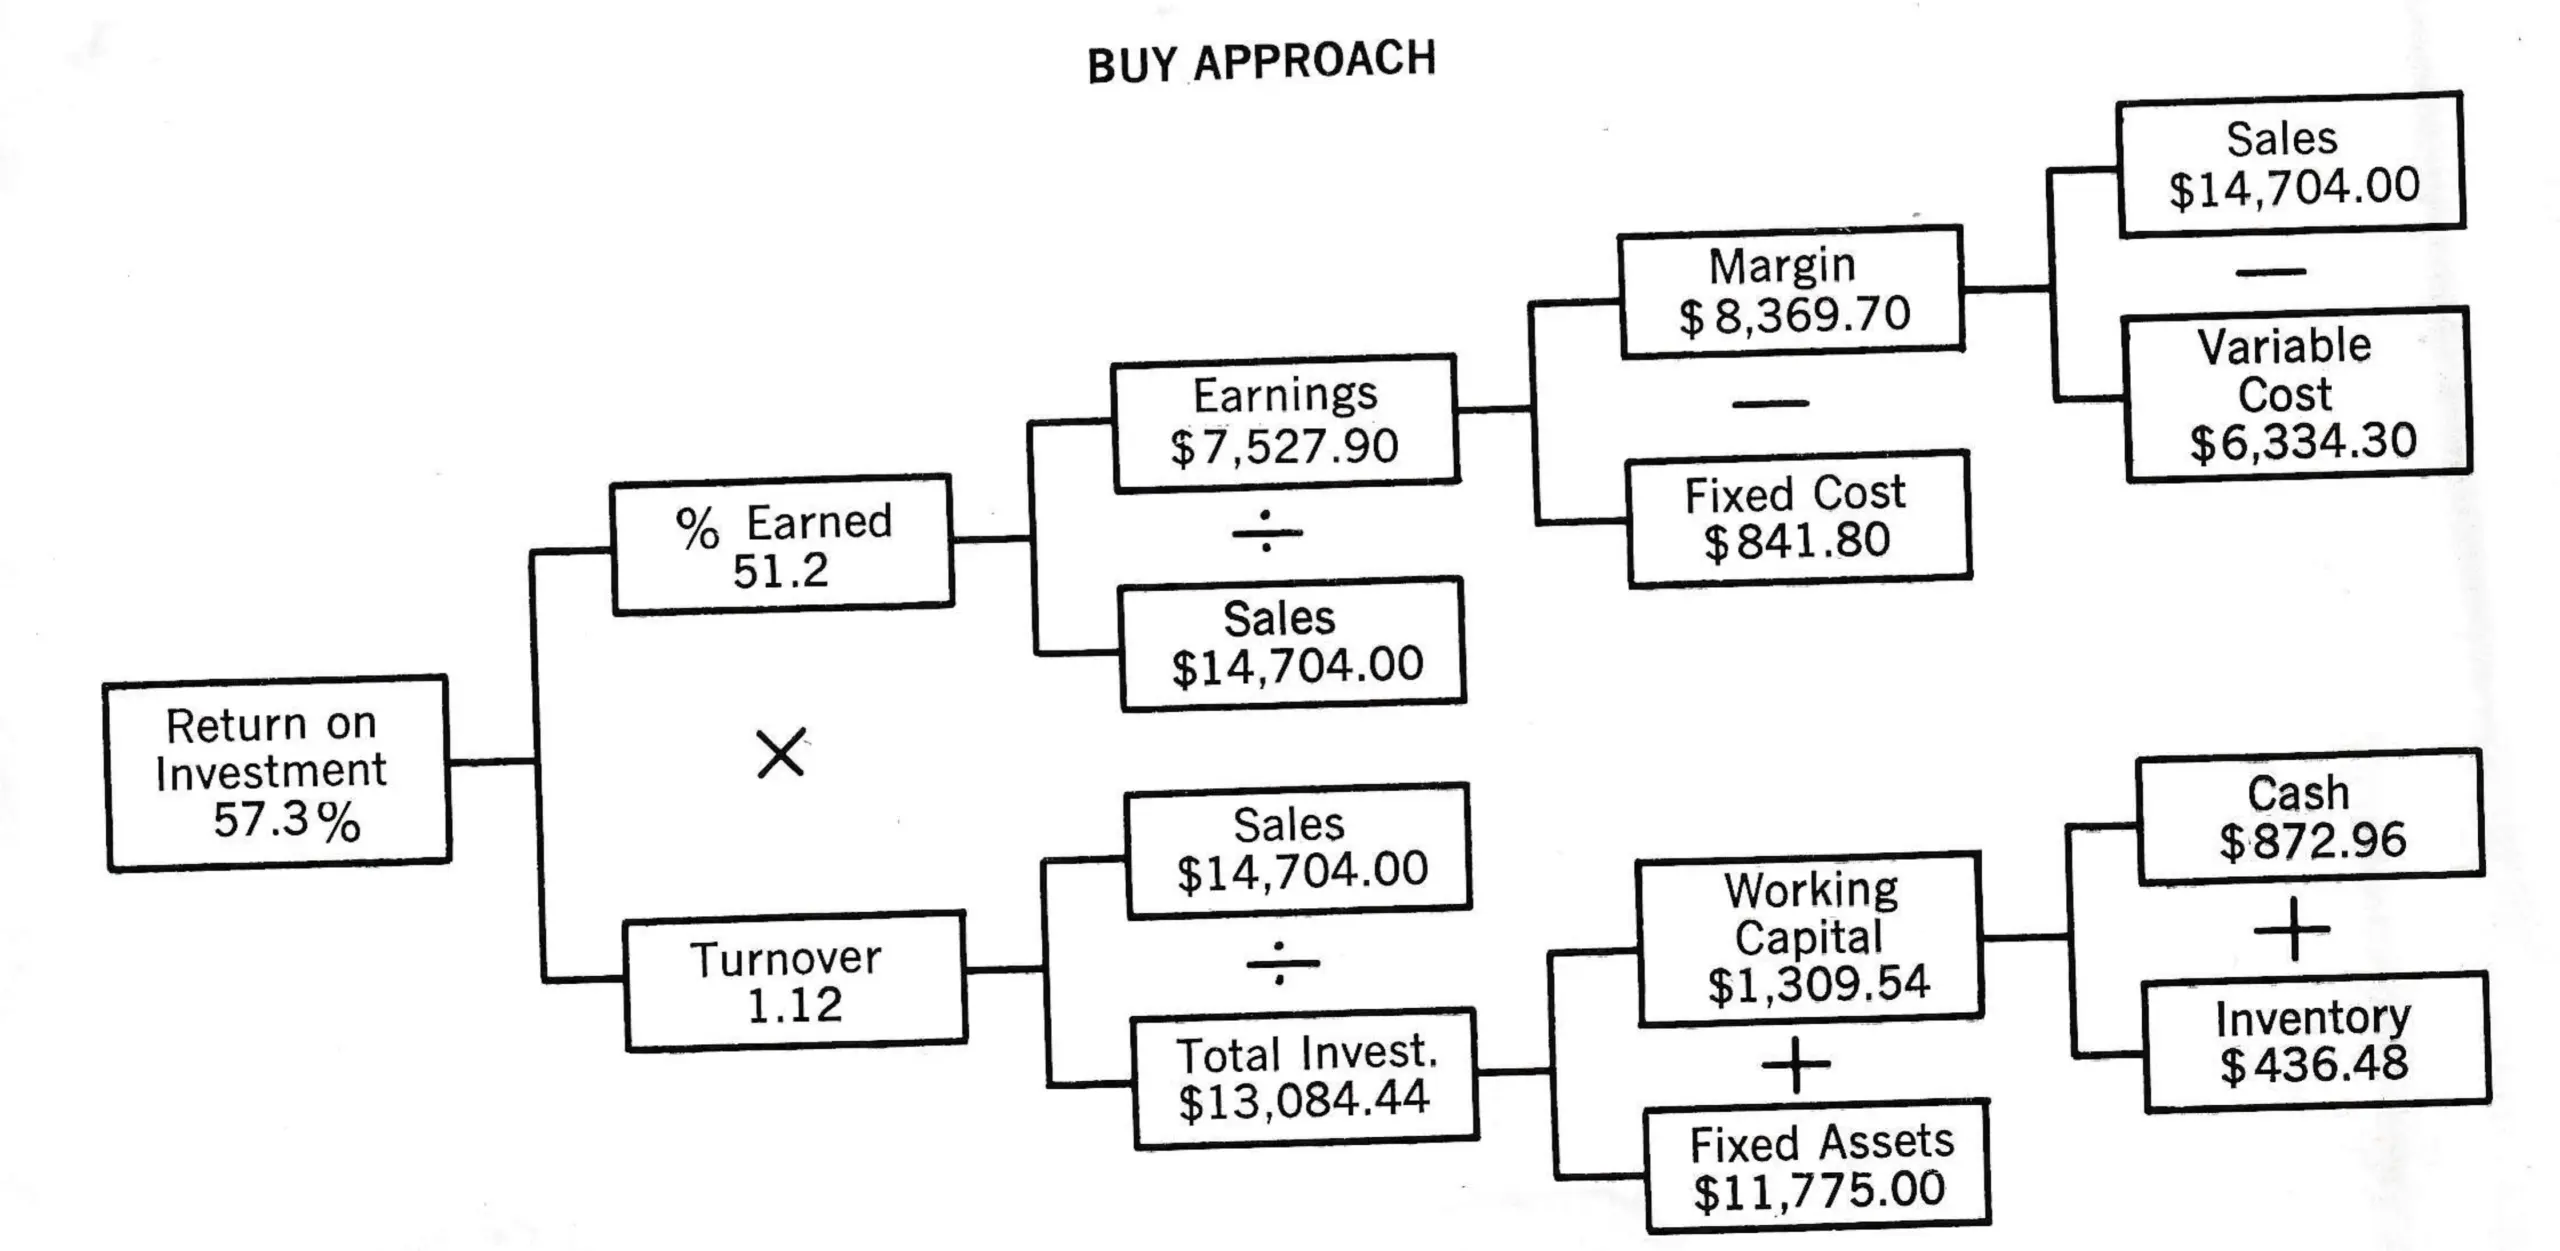
The final test determines whether the capital required to have pastry on the menu gives a better yield under a bake or a buy approach. These calculations are made in Table V using a return on investment model. Taxes have been ignored and current assets reflect a level equal to three weeks of inventory. As could be predicted, the buy approach yielded the best use of investment capital.
Does this mean everyone should buy pastry? Not necessarily. There are many costs associated with production which are not readily apparent. Equipment and space must be used to capacity to justify the investment and only with careful analysis can sound decisions be made in a food operation.