


Understanding the physical differences between installing a top drive versus a bottom drive of a lift helps in evaluating the actual cost differences and where they come from. The required equipment, installation and operating cost must all be considered to make a fair evaluation. As an example let’s look at a hypothetical quad chair with a capacity of 2,400 pph at a speed of 500 ft/min and assume the lift has a fixed drive station and a return tension station. The illustration diagrams cable tensions and technical information for both drive configurations.
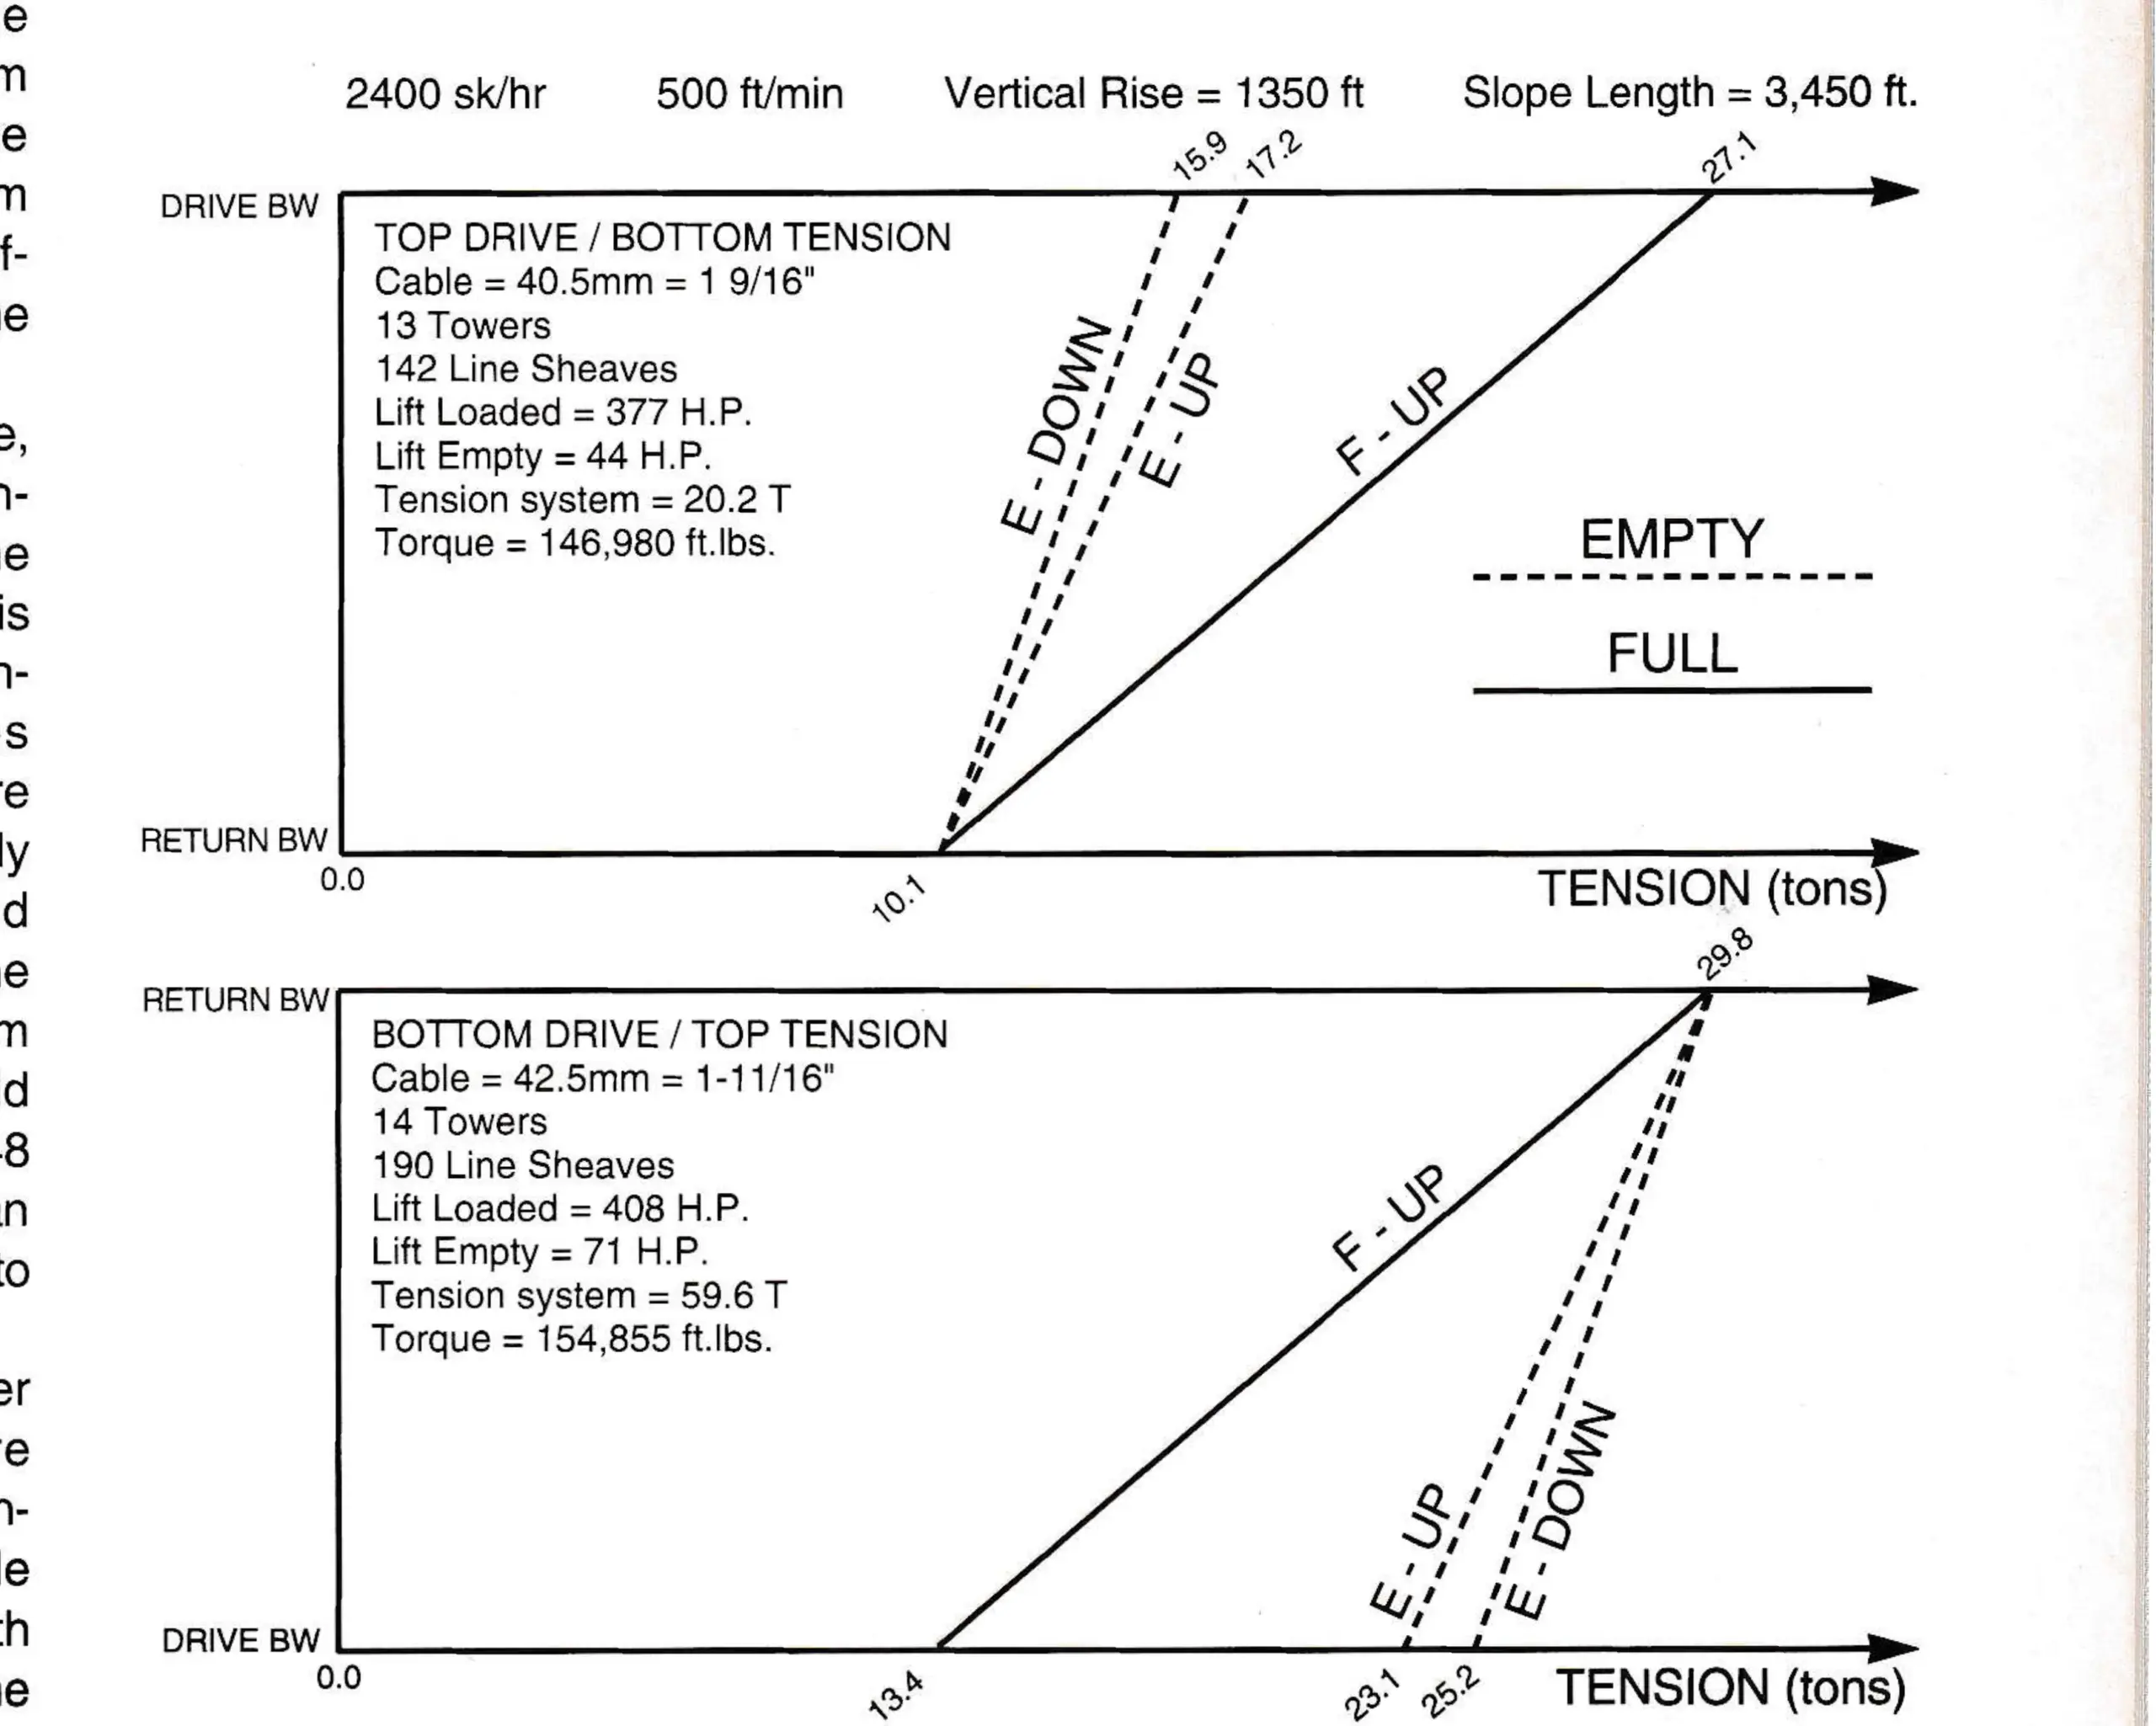
At first glance you probably notice that the cable tensions are higher in the bottom drive case. The main reason for this is that a bottom drive needs to have adequate tension at the drive bullwheel to prevent the cable from slipping on the bullwheel liner. This increase in minimum tension at the bottom is carried up the line and reflected in an increase in maximum tension at the top. The most drastic difference in cable tension is reflected in the case of an empty lift (dashed lines).
Notice that in the case of the top drive, the dashed lines reflect much lower tensions than in the bottom drive case. The uphill side only is affected when the lift is loaded and the empty downhill side maintains the same tension at all times (assuming no downhill load). With more tension in the cable there is appreciably more load at the breakover and hold down towers. In this particular case the increased tension required for a bottom drive result in the addition of one hold down tower at the bottom of the lift, 48 line sheaves, use of a larger cable and an increase in torque and horsepower due to the added line friction.
The terminals must also resist higher cable tensions which in turn require stronger structural frames and more concrete in the foundations. This example reflects a relatively smooth profile, with the only hold down towers being at the bottom terminal and the only breakover towers being at the top terminal. On a rough profile, requiring hold downs and breakover towers at various locations along the line, the additional equipment, torque and horsepower requirements for a bottom drive would be even greater.
For the same capacity a bottom drive can carry a price tag in the vicinity of 10 to 20 percent more than a top drive, depending on size and terrain. Conversely, a top drive can achieve 10 to 15 percent more capacity than its bottom drive counterpart, utilizing the same equipment. Of course the larger the lift and the rougher the profile the more pronounced these differences become. We have considered a fixed-drive/return-tension in our analysis but the same principles apply to a drive-tension/fixed-return, whether it be a fixed grip or a detachable. Drive location makes the greatest difference.

Equipment and installation do not represent the only considerations for cost differences however. Consider power and maintenance requirements over the life of the lift. For example, a difference of 25 horsepower, operating eight hours a day for 175 days per year, translates into 26,110 KWH per year. If we estimate average electricity cost at .08¢ per KWH, the annual difference in the electrical bill between our top and bottom drives is $2,089.00. Assuming electrical cost stays even with inflation during the life of the lift, and neglecting additional demand charges, the difference in electrical cost between top and bottom drive over 30 years adds up to $62,700 in today’s dollars.
Then there is maintenance, where costs will relate directly to the amount of line equipment and horsepower a lift has. The difference in maintenance and power requirements over the life of the lift can add to a sizeable chunk of cash. This should not be left out of the equation when making the decision between top or bottom drive.
From our analysis it is pretty obvious that a top drive is the way to go when feasible. However, each situation is different, an in many cases a top drive is just not an option. The main problems with installing a top drive are usually access and power. And what about personnel transportation for start-up and shut down, or getting heavy components like the electric motor down the mountain?
Or, is it worth it to run power to the top terminal or improve that road so that the drive can be delivered? It just may be, especially if several lifts will be topping out in the same vicinity. This decision requires a hard look and consideration of the long term to get the most out of your investment.