During the 1980’s, the buzz phrase in the ski industry was the “flat market.” If ski resort operators’ enthusiasm for a national advertising campaign is any indication, then “up trend” could well be the buzz phrase in the 1990’s. As with most popular expressions, both of these are oversimplifications of what is really happening in the ski industry.
To get a perspective of where the industry is going in the 1990’s, we need to take a look at how the industry got to where it is now. Also, we need to watch several key trends — not just the total industry trend. If we do that, then what we will see is that the 1980’s were not as bleak as they may have seemed and that the industry is well positioned for the 1990’s.
Beyond First Glance
Since 1980, the NSAA End of Season National Business Survey (NEOS) has been showing relatively slow growth in total skier visits and, consequently, there is much talk about the market being flat. There is nothing wrong with this view from a purely descriptive standpoint, but it is grossly misleading from an analytical and problem-solving standpoint. In doing the NEOS study, we deliberately take steps to try to show a clear picture of how the ski business is faring by presenting it from several different angles. Yet, many people seem to look only at the industry total for an indication of whether business was up or down.
Take the 1988-89 season, for example. At first glance, with total skier visits down one percent, it may look like demand weakened. However, considering the fact that snowfall was off 30 percent in the East, it was amazing that the skier visit total stayed as close to last year’s record level as it did. I see that as a sign of market strength — not weakness.
In the NEOS report we also showed the following: Survey respondents’ skier visits rose three percent. NSAA members’ skier visits remained at record levels. Other business items (passes, lessons, etc.) all rose significantly with most breaking records. We also showed that skier visits for NSAA members are on an upward trend regionally for most parts of the country. Over a nine-year period beginning in 1979, skier visits increased 42 percent in the Northeast and 83 percent in the Southeast. The Rocky Mountain region had slow growth at 10 percent. Pacific West’s skier visits were flat, but that was due primarily to several poor snowfall years. That leaves the Midwest, where a bonafide flat market due to soft demand may have occurred and even there poor snowfall was a contributing factor.
In 1987, after several years of reading about a “flat market” and observing major ski resorts behaving like a “growth industry,” I decided to research the problem to see how much of the market was flat and how much was growing. In 1988, as a result of this investigation, we published Growth Trends of NSAA Ski Areas in the 1980’s.
One of the major conclusions of that study showed a dominant sector of the industry was indeed growing and doing so at a fairly impressive rate. We found that 145 NSAA regular respondents had a 36 percent average growth rate in skier visits over a nine-year period. We also found that there was a declining sector composed mostly of small ski areas. During the nine years, 149 of the industry’s 823 ski areas went out of business — most were small, non-members of NSAA.
Diverse Sectors
Our findings in the growth-trend study suggest that the industry is composed of two sectors that are going in opposite directions. One sector is made up of larger, commercialized, technologically advanced, generally progressive, growth-oriented ski resorts. The other is made up of smaller, less commercialized, neighborhood-oriented, less technologically advanced, capital-limited ski areas.
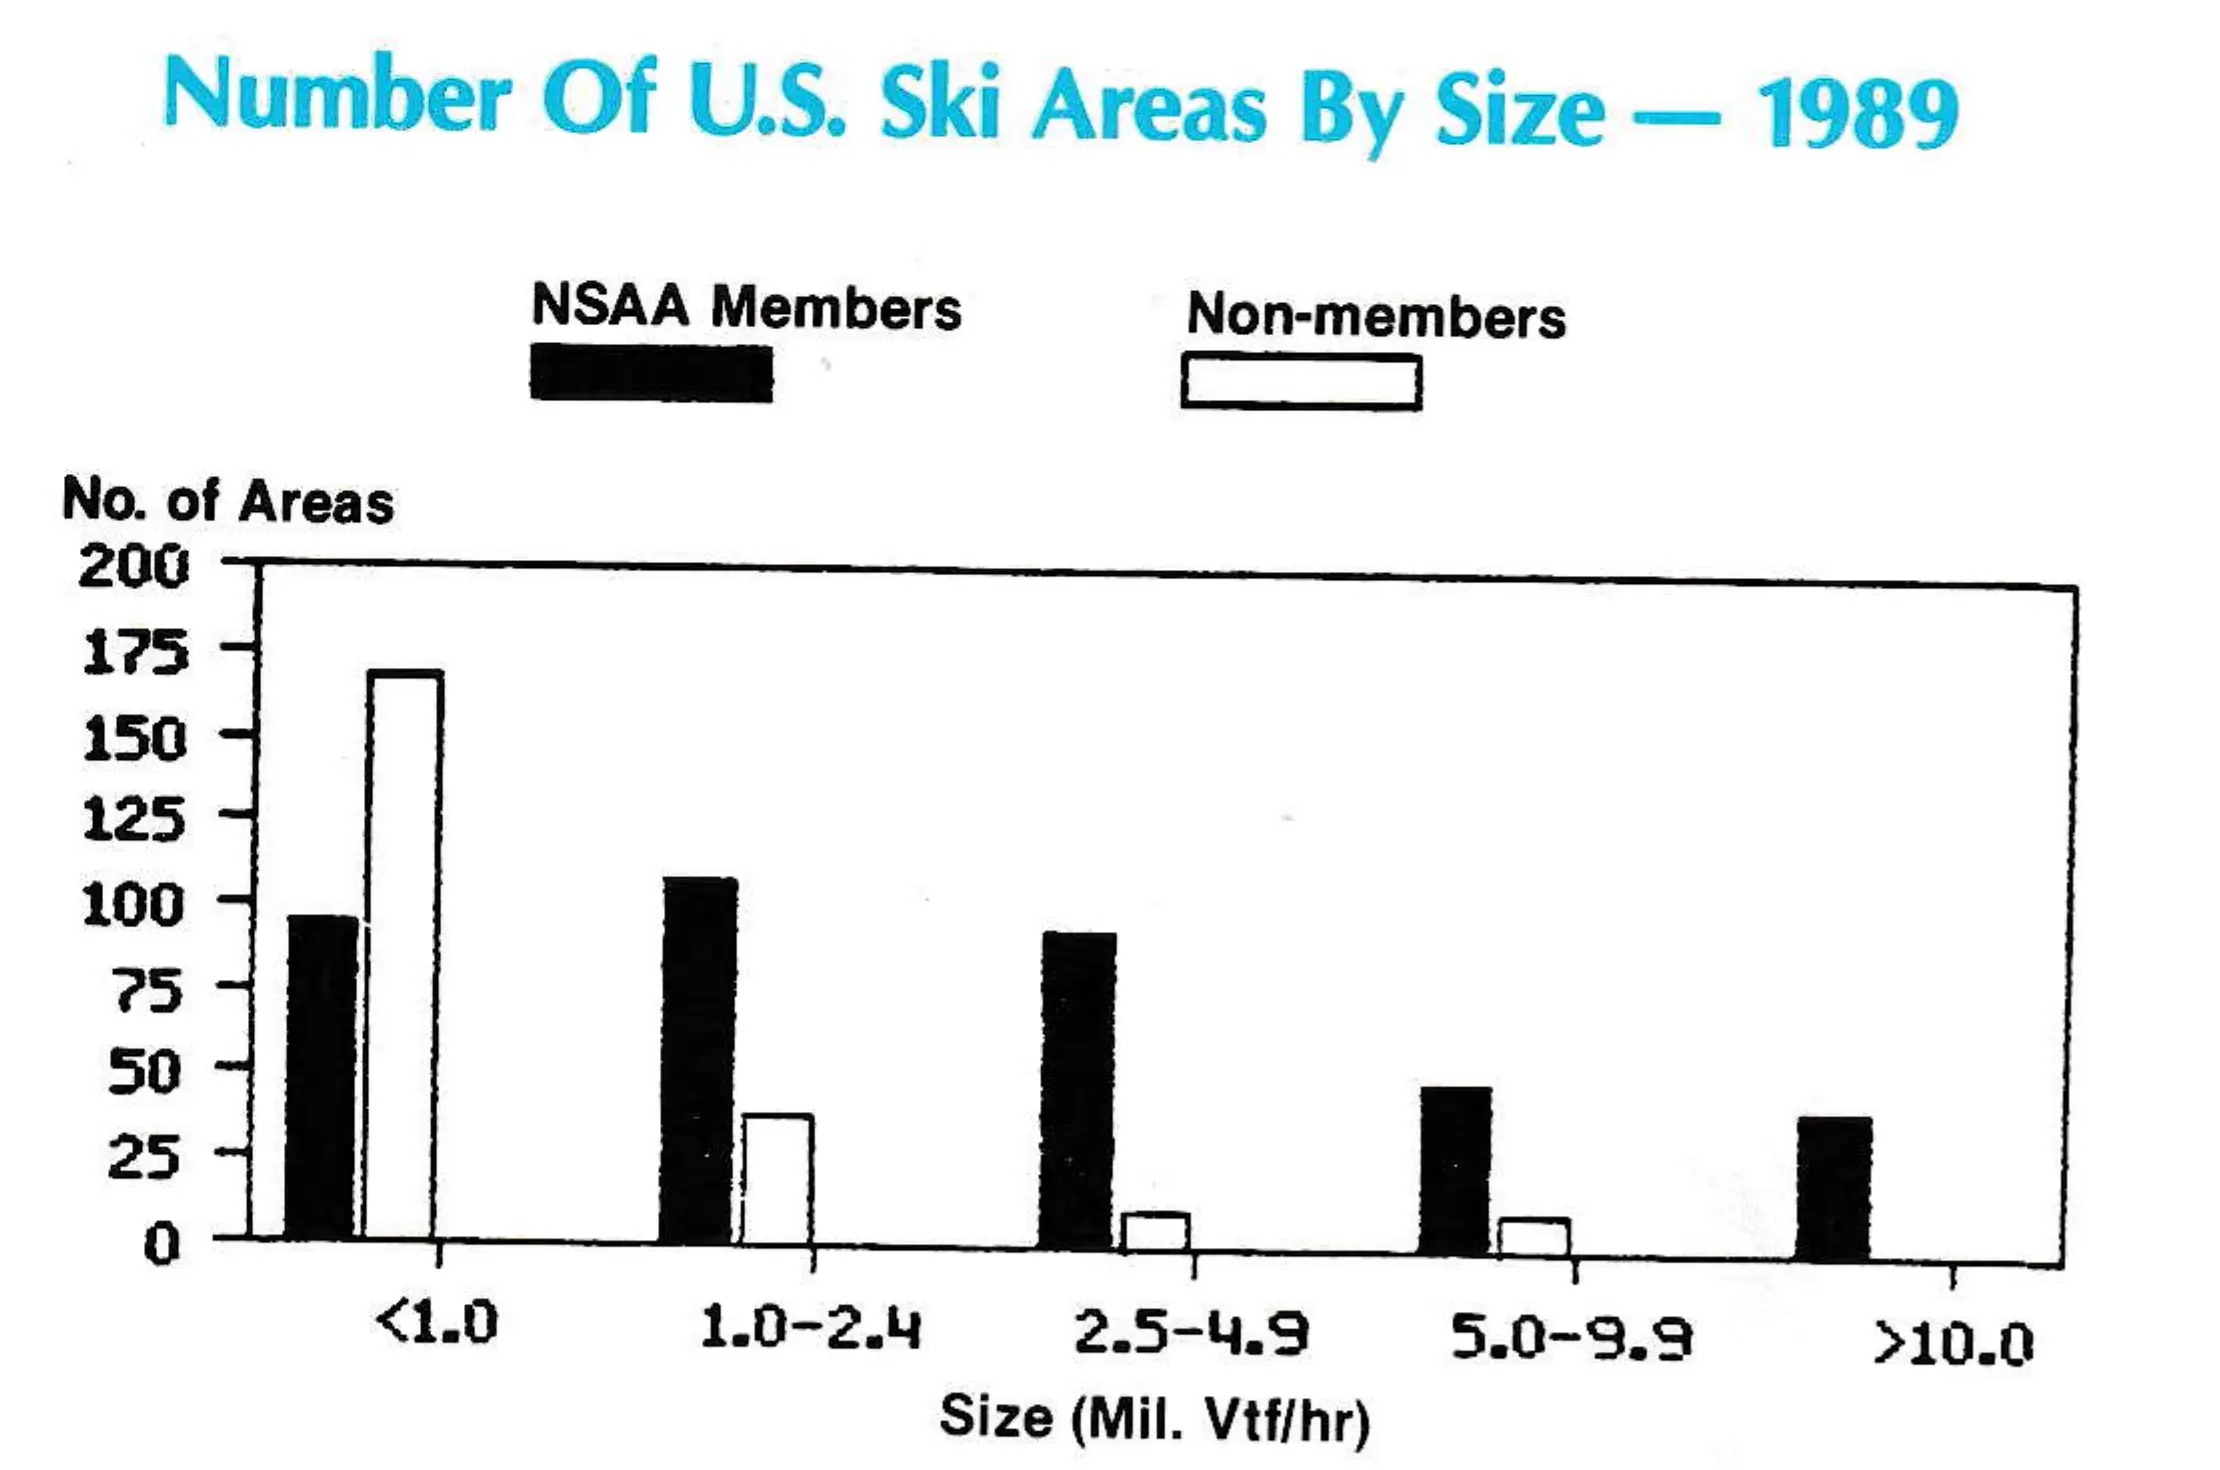
It is not possible to say exactly which and how many ski areas fall into each sector — the definitional categories are not mutually exclusive. Some small ski areas qualify for the first sector and some large ski resorts fit in the second.
I have not been able to come up with good descriptive names to identify the sectors; therefore, I simply refer to the more commercialized as Sector I and the less commercialized as Sector II. For purposes of this article, I use NSAA membership as a proxy to represent the two sectors. Most NSAA member ski areas come reasonably close to fitting Sector I and most non-members come sufficiently close to fitting Sector II.
Behavior
Using this two-sector approach, we can get a clearer picture of what has been happening in the U.S. ski industry.
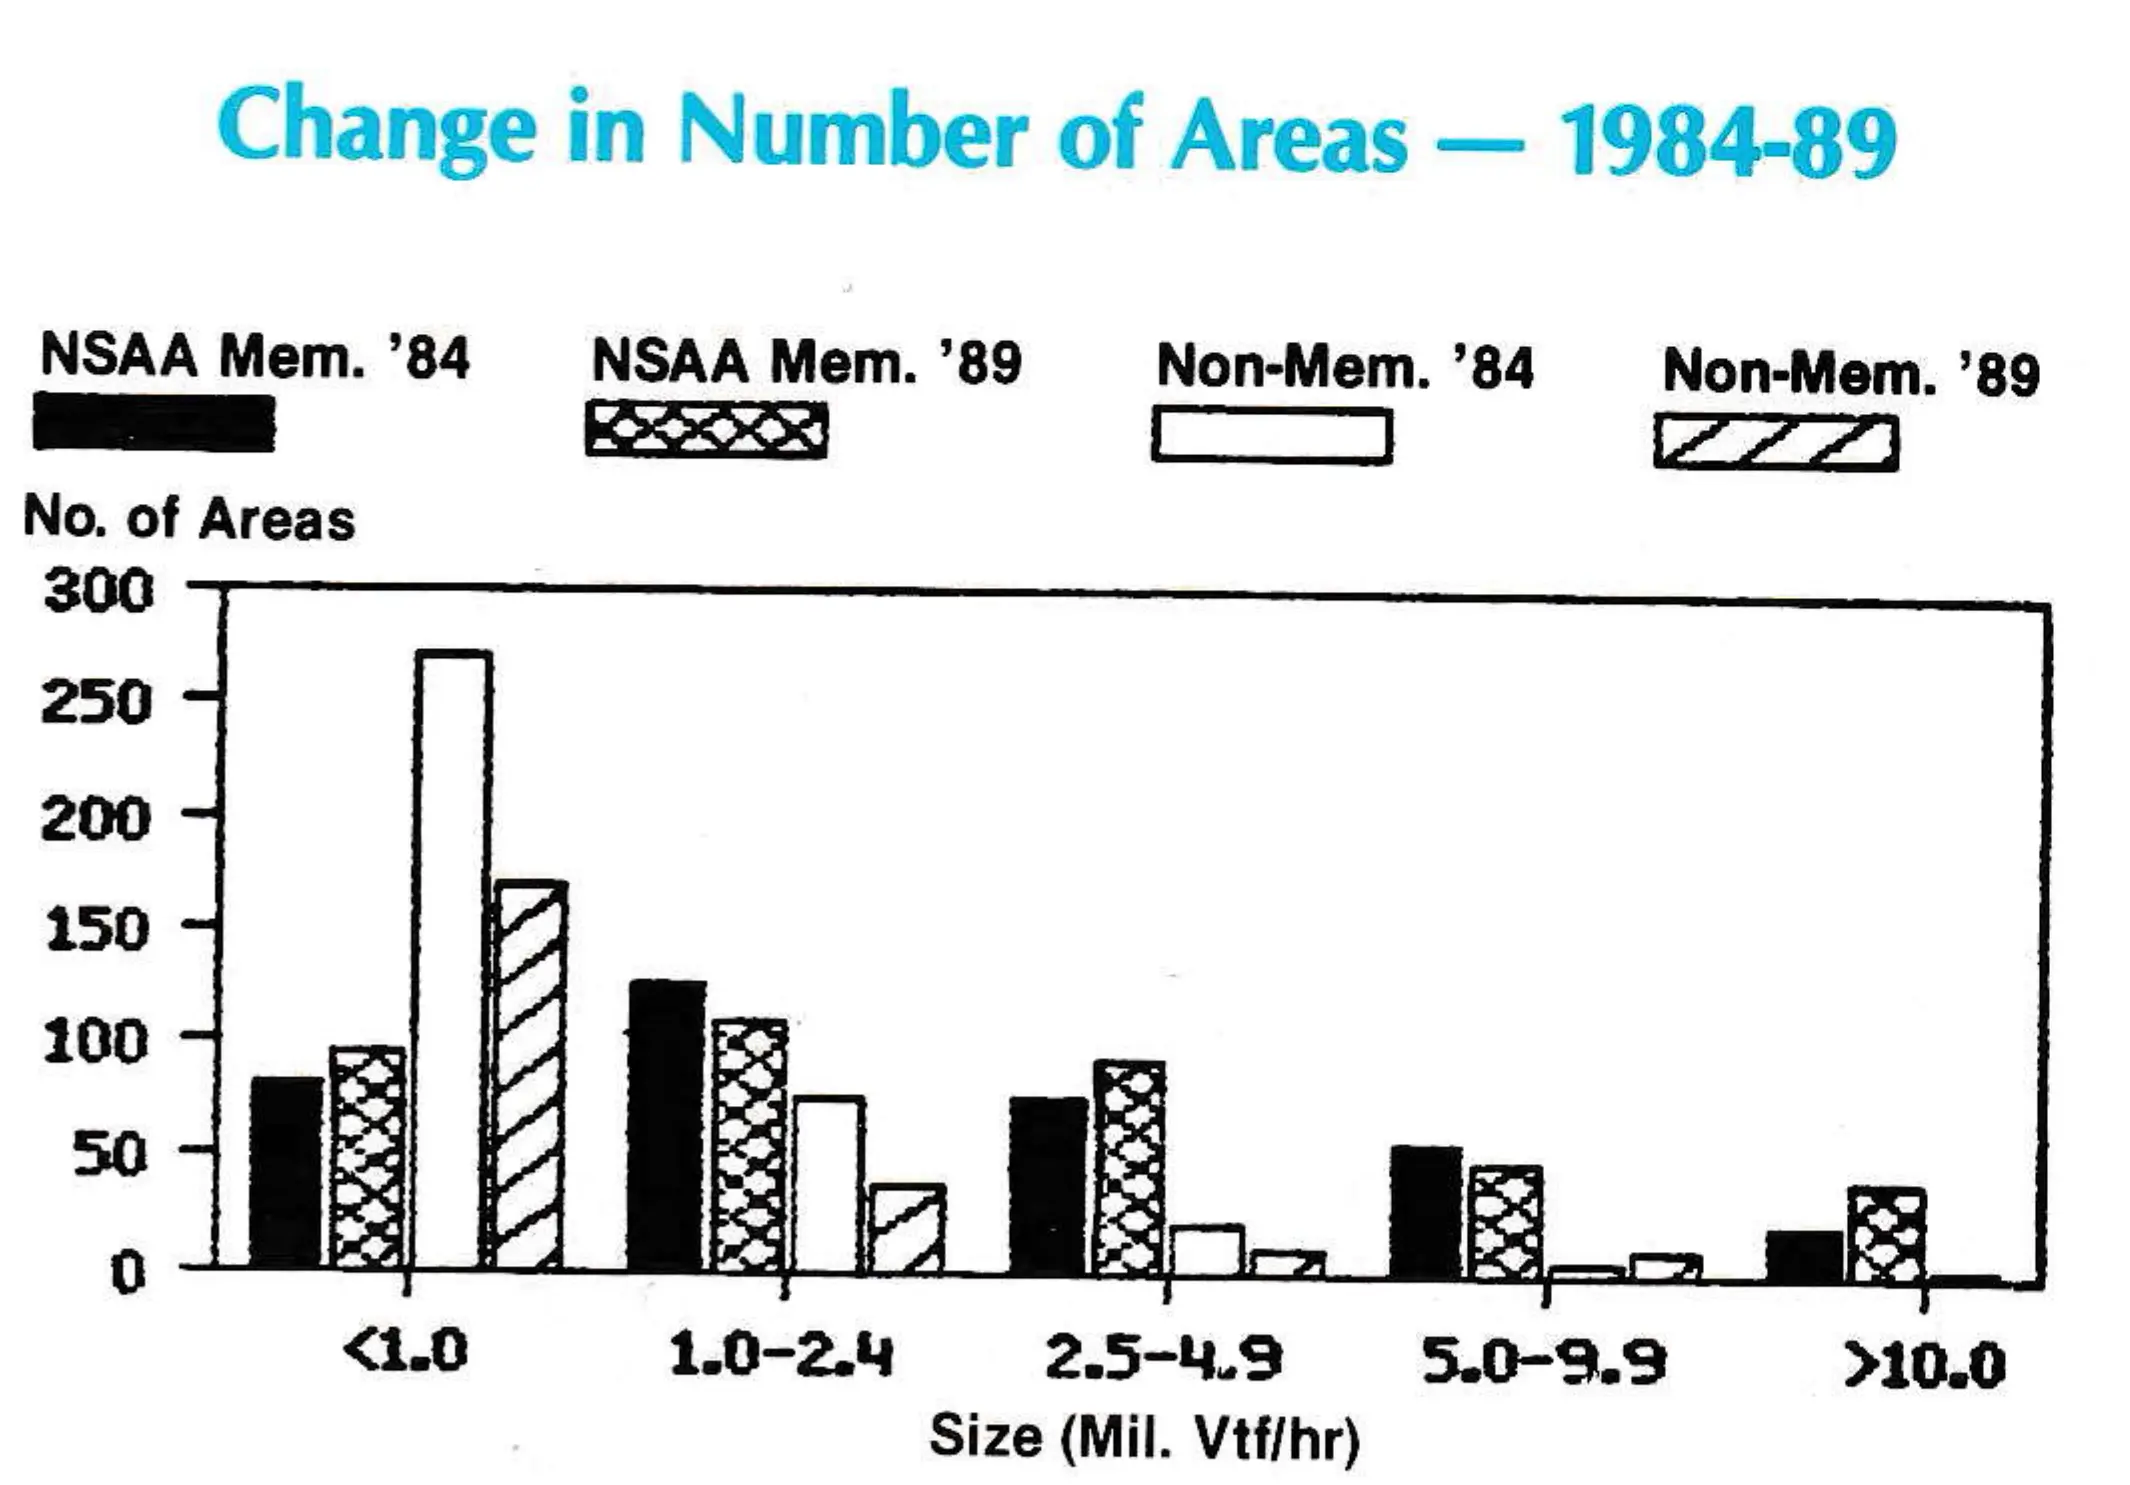
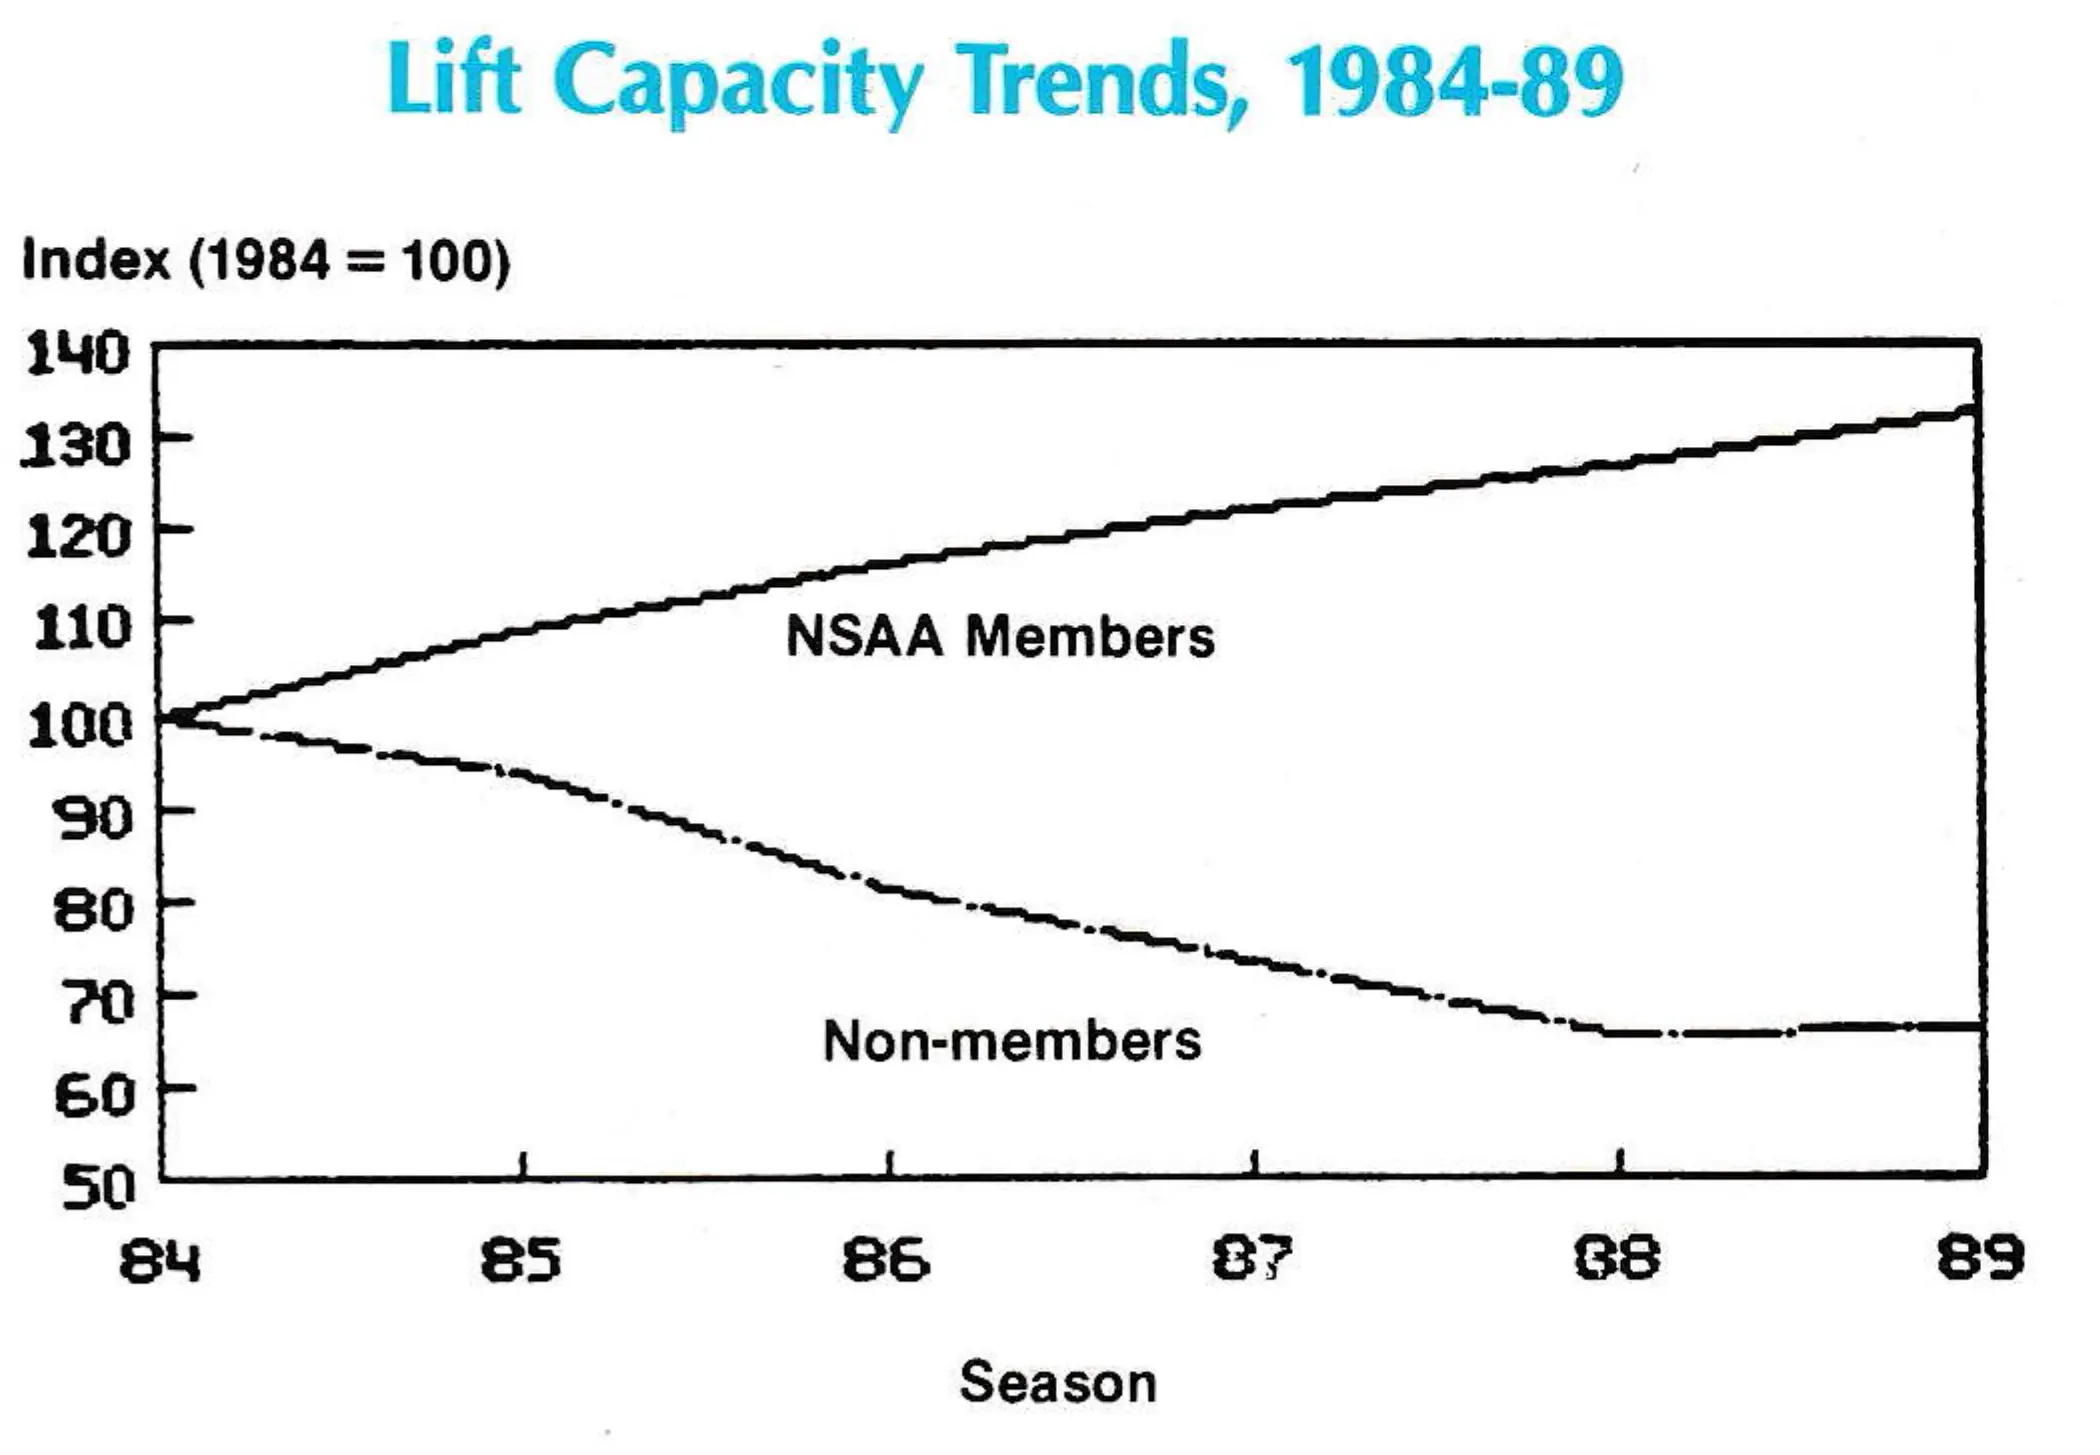
Typically, a growth industry invests heavily in capital resources and plows much of its annual profits back into the business. That is what is happening in Sector I — lift capacity increased 33 percent in the last five years — annual capital improvement outlays in the summer of 1987-88 were double that for 1982-83.
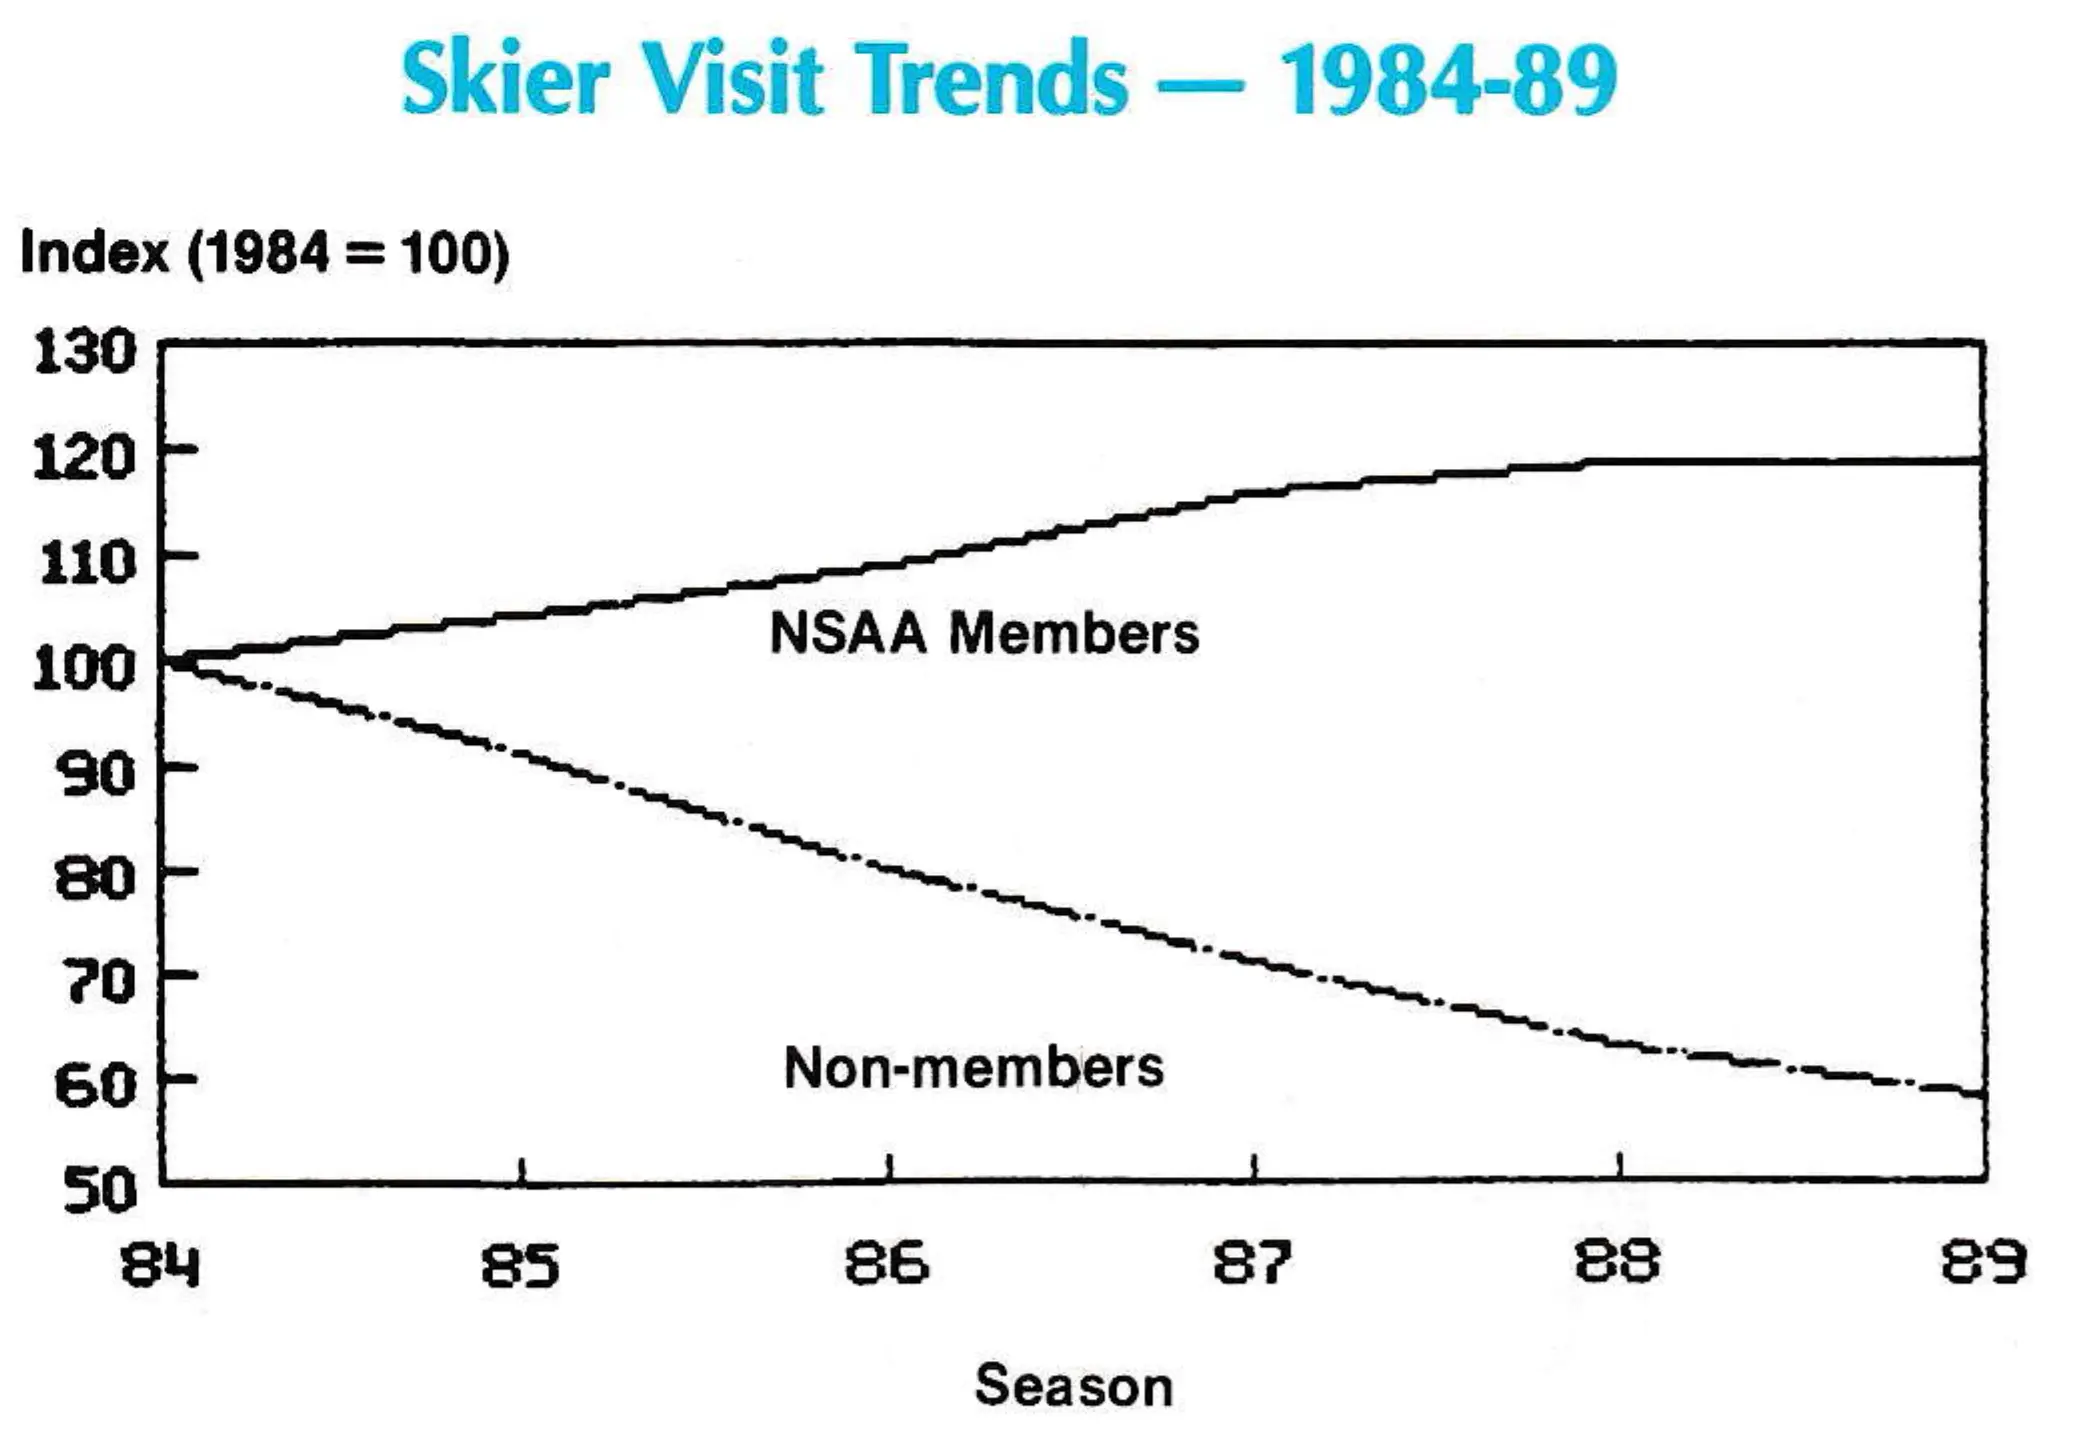
At the same time, skier visits increased 19 percent in Sector I, which is not as great as lift capacity growth, but definitely better than flat.
Technological/Capital Expansion
There are many reasons why supply has a tendency to outpace demand in a growth industry. One reason is that some industries have so many firms it pays for an individual firm to expand even though total market supply exceeds market demand (a cutback by one firm among many does not make enough difference to have a noticeable effect on reducing supply and raising price).
By comparison, in industries having only a few firms, each firm can have an influence on supply and, consequently, it pays for them to practice monopolistic competition by managing supply. Computer manufacturing is an example of a growth industry which at one time had few firms. IBM held a dominant position among a few firms in the early years of main-frame computer sales. IBM’s patents practically excluded entry of new firms and gave it a high degree of influence on supply. Then along came Apple with a personal computer and the whole market structure changed as many new firms entered the race to capture a piece of that fast growing market. Following that stage of the computer industry’s growth, supply began to exceed demand (too many clones). Consequently, a period of weeding out followed.
The ski industry, with about 600 ski resorts, is also going through a weeding out stage (“dropping out” would be a more appropriate term in this case). In 1978-79, there were over 800 ski areas in the U.S. Currently, there are nearly 400 competitive ski resorts in Sector I and about 200 in Sector II.
In some respects, the ski industry resembles the agriculture industry. Since World War II, agriculture has been in a technological revolution that increased its capacity to produce food and fiber many fold. The U.S. agriculture industry is the envy of the world. It is so productive that supply chronically exceeds demand. Many farmers drop out of the technological/capital expansion race. For those who stay, it pays to continue expanding. In the same sense, progressive ski resorts stay and expand, while smaller, non-progressive ski areas get left behind and drop out of the race.
Low Profits/Capital Growth
Relatively low annual profit is common in growth industries. Those ski areas that respond to NSAA’s Annual Economic Analysis of North American Ski Areas survey report an average of about six percent “Operating Profit as a Return on Gross Fixed Assets,” but assets have grown substantially in value. IBM pays its stockholders about five percent in dividends, but the value of IBM stock has risen greatly over the years. Farmers struggle on low profits year after year, but accumulate considerable amounts of capital assets in a lifetime.
In order to achieve growth, it is often necessary to forego some current net profit to obtain greater future capital gains. Reinvesting profits and using credit leverage tends to lower current net earnings in the early stages of technology adoption while it accelerates the process of capital accumulation. When investors choose growth stocks, they accept low or even no annual dividends, realizing that capital gains will probably more than make up for what they forego in dividends.
Unfortunately, for highly leveraged ski resorts, there could be a hitch on the golden path of growth. Low annual profit causes a financial risk problem. If a firm cannot make annual credit repayments because annual profit is too low, the firm may be headed toward bankruptcy.
Like any growth industry, the ski industry has its share of bankruptcies and financial crunches. Up to now, few ski areas under Chapter 11 have vanished from the industry. Most have been financially reorganized or bought out by other investors. As a consequence, firm growth continues even for some that experience financial crises.
Lack of Inventory Control
Naturally, investing in a growth industry means taking on a lot of risk. Growth can be impeded or accelerated by drastic changes in the weather or the economy. One way that business firms can deal with such risks is by using storage and inventory control. In a lean year, IBM can carry over some of its unsold PCs until next year. Farmers can store a crop surplus in U.S. government storage bins.

Unfortunately, ski resorts are disadvantaged on this score. An abundance of snow cannot be carried over to the next season and too much rain on weekends can mean empty chairlift seats for which the loss cannot be recouped. Ski resorts have a perishable product that cannot be stored. Because of this, ski resorts must have an alternative to storage for dealing with the ups and downs in skier demand and the vagaries of weather. Their alternative is to expand capacity to accommodate peak crowds based on a probability of peak demand occurring and to maximize coverage of slopes with snowmaking to insure a stable supply of skiable terrain.
Economies of Size
Finally, firms in a growth industry endeavor to achieve economies of size, which basically means that by selling or buying in large volume they are able to minimize overhead unit costs. When an industry has many firms, some industry-wide economies can be obtained through the industry’s trade organization.
A good example of that is the ski industry’s plan to conduct a national television advertising campaign during the next five years. In today’s mass marketing world, it is imperative that the ski industry move into TV advertising to maintain a competitive edge in quest of tourism dollars. For any single ski resort, the cost of national TV advertising would be prohibitive. Pooling of funds is an obvious solution.
Another area where it makes sense for the ski industry to pool funds is in research and development. R&D is a high priority program in most growth industries. IBM can afford to have its own R&D division. Individual farmers cannot afford to do their own research, so they depend on the U.S. Department of Agriculture and Land Grant Colleges to do the research for them.
Some large ski resorts are able to fund their own research projects and many, large or small, can fund research pertaining to their own operation. However, research on regional and national developments could be effectively sponsored and conducted on a fund-pooling basis through the USIA. As members of a growth industry, ski resorts would do well to encourage their newly-formed national organization, USIA, to place a high priority on expanding their R&D programs.
Out of the Race: Sector II
Having made the case that Sector I behaves like a typical growth industry, I now turn to Sector II’s behavior which is quite different. Although Sector II ski areas are declining in number, they still play a vital role in providing skiing opportunities for the public. It is important, however, to recognize that the product offered by Sector II differs markedly from that offered by Sector I. Although we give equal value to all skier visits, a skier visit in Sector I is not really the same as a skier visit in Sector II.
Over 74 percent of Sector II ski areas have less than one million VTF/HR lift capacity (average runs about 370,000 VTF/HR). At this size level, these small ski areas average about 13,500 skier visits per year, which means their annual budgets range from $100,000 to $150,000. Most are rope tow operations on hills having 100 to 300 feet vertical rise. Their major attractions are that they offer convenient access, inexpensive lift tickets, a community atmosphere and a nearby place to practice skiing. Some are owned by clubs, some are publicly-owned (towns, cities, schools) and many are privately-owned.
It is said that small, local ski areas serve as feeder schools for large, destination ski resorts. While this may still be an important role for intermediate ski areas, it is becoming less so for small ski areas.
In 1983-84, the smallest-sized ski areas (with less than one million VTF/HR lift capacity) accounted for an estimated 14 percent of total ski lessons given in the ski industry. Five years later, they accounted for about four percent. That amounts to a 66 percent drop in ski lessons at these areas. Part of this change was due to a 26 percent drop in number of ski areas of that size (352 in 83-84 and 262 in 88-89). The other part was due to a lower average number of lessons per small ski area. Sixty-four percent of these small ski areas were not members of NSAA in 1988-89.
As a group, the very small ski areas face difficult obstacles to staying in business. Limited capital funds, high liability insurance costs and lack of consistently good snowfall have hampered operations. Moreover, many operators of ski areas tend to be independent-minded. Their response rate to economic surveys is extremely low; many seem not to keep very good business records and most seem not to be joiners, as evidenced by their not being members of NSAA. A nationwide TV advertising campaign is not likely to generate enough response among those who ski at these areas to increase their demand sufficiently to halt the decline in number of ski areas.
A point that needs to be made is that the problems in Sector II differ from those in Sector I. Somebody ought to be looking at the transition problems of Sector II. Those ski areas, which are able to survive the ongoing avalanche of economic change, need information on whether they should optimize at the small size level, expand to a large size or drop out of business. Perhaps a new organization called the “Small Ski Areas Association” is needed to pool funds for economic research on transitional problems facing ski areas in Sector II. (This is said somewhat facetiously, because just above I said most Sector II ski operators seem not to be joiners.)
Trends to Watch in the 1990’s
Given the foregoing background, we now turn to suggestions on what trends to watch and where to find them. I believe that we should be watching at least three trends — not just the total industry trend.
Next time you have a chance to read a copy of the NSAA End of Season report, turn to the trend table on NSAA skier visit volume. This gives data that is representative of Sector I ski areas (that trend shows a 19 percent growth rate in skier visits since 1983-84).
Second, look at tables that give non-member skier visit estimates — these are representative of Sector II (that trend is down 42 percent since 1983-84). Third, turn to tables that present the total for the ski industry — NSAA and non-member skier visits combined (that was up five percent since 1983-84).
Obviously, there is much more that one can glean from the NSAA End of Season report. Most importantly, I trust that it is now clear that neither sector faces a flat market — one sector’s trend is up and the other’s is down.
What are the prospects for these trends to continue on the same course in the 1990’s? Barring any catastrophic event, the diverse courses of the two sectors are bound to continue in the 1990’s for reasons discussed above. Beyond that, the prospects are good that the industry’s national advertising campaign will give an added boost to Sector I’s upward trend. It will be interesting to see whether the added boost will be large enough to significantly offset Sector II’s persistent downward trend.
One thing is sure, the 1990’s promise to be a great time not only for skiing, but also for chart-watching.