


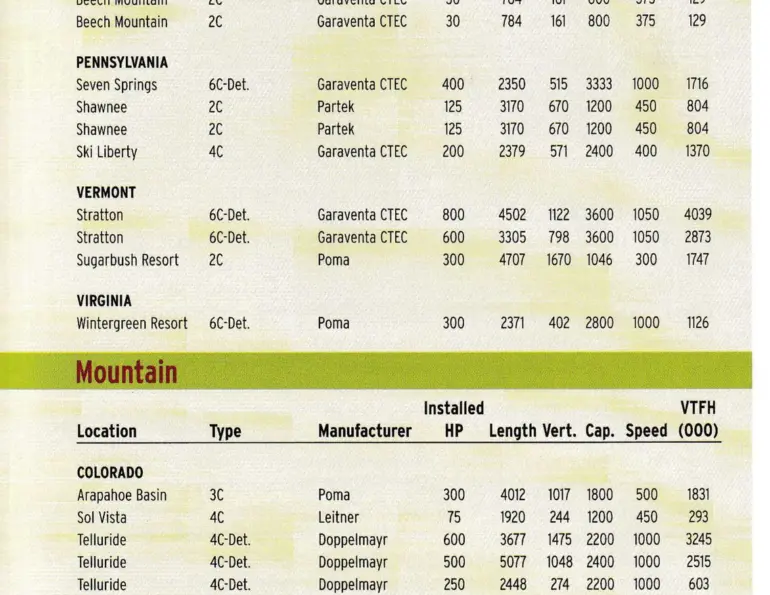
What do you say about a lift construction year like 2001? Do you make happy by focusing on the one bright spot, the East, where lift totals doubled over the (horrendously bad) previous year and VTFH totals soared by almost 50 percent? Or do you show the whole picture, train wreck and all?
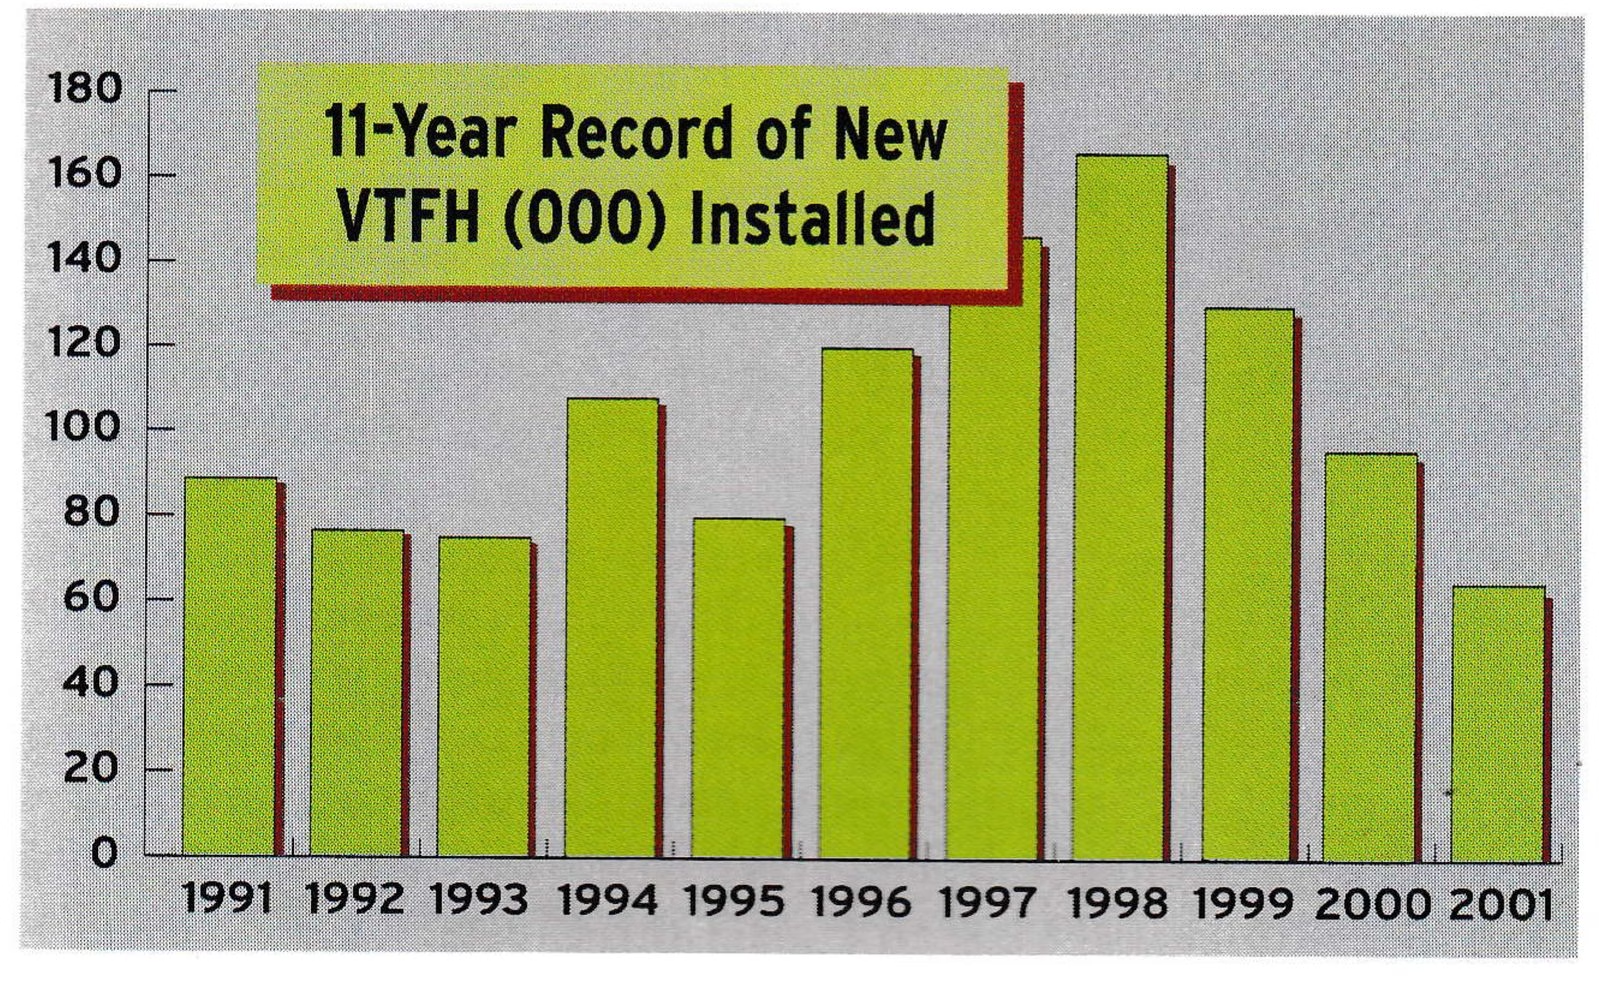
Well, let’s spell it out. The total number of new lifts, 37, is the lowest since the 36 tallied in 1992. The VTFH total for new installations in all of North America is 64,639 and you have to go back almost a quarter century to 1977, when Jimmy Carter was President, to get one that low (60,057). Good grief, the Mountain states alone racked up almost 70,000 in new VTFH just three years ago.
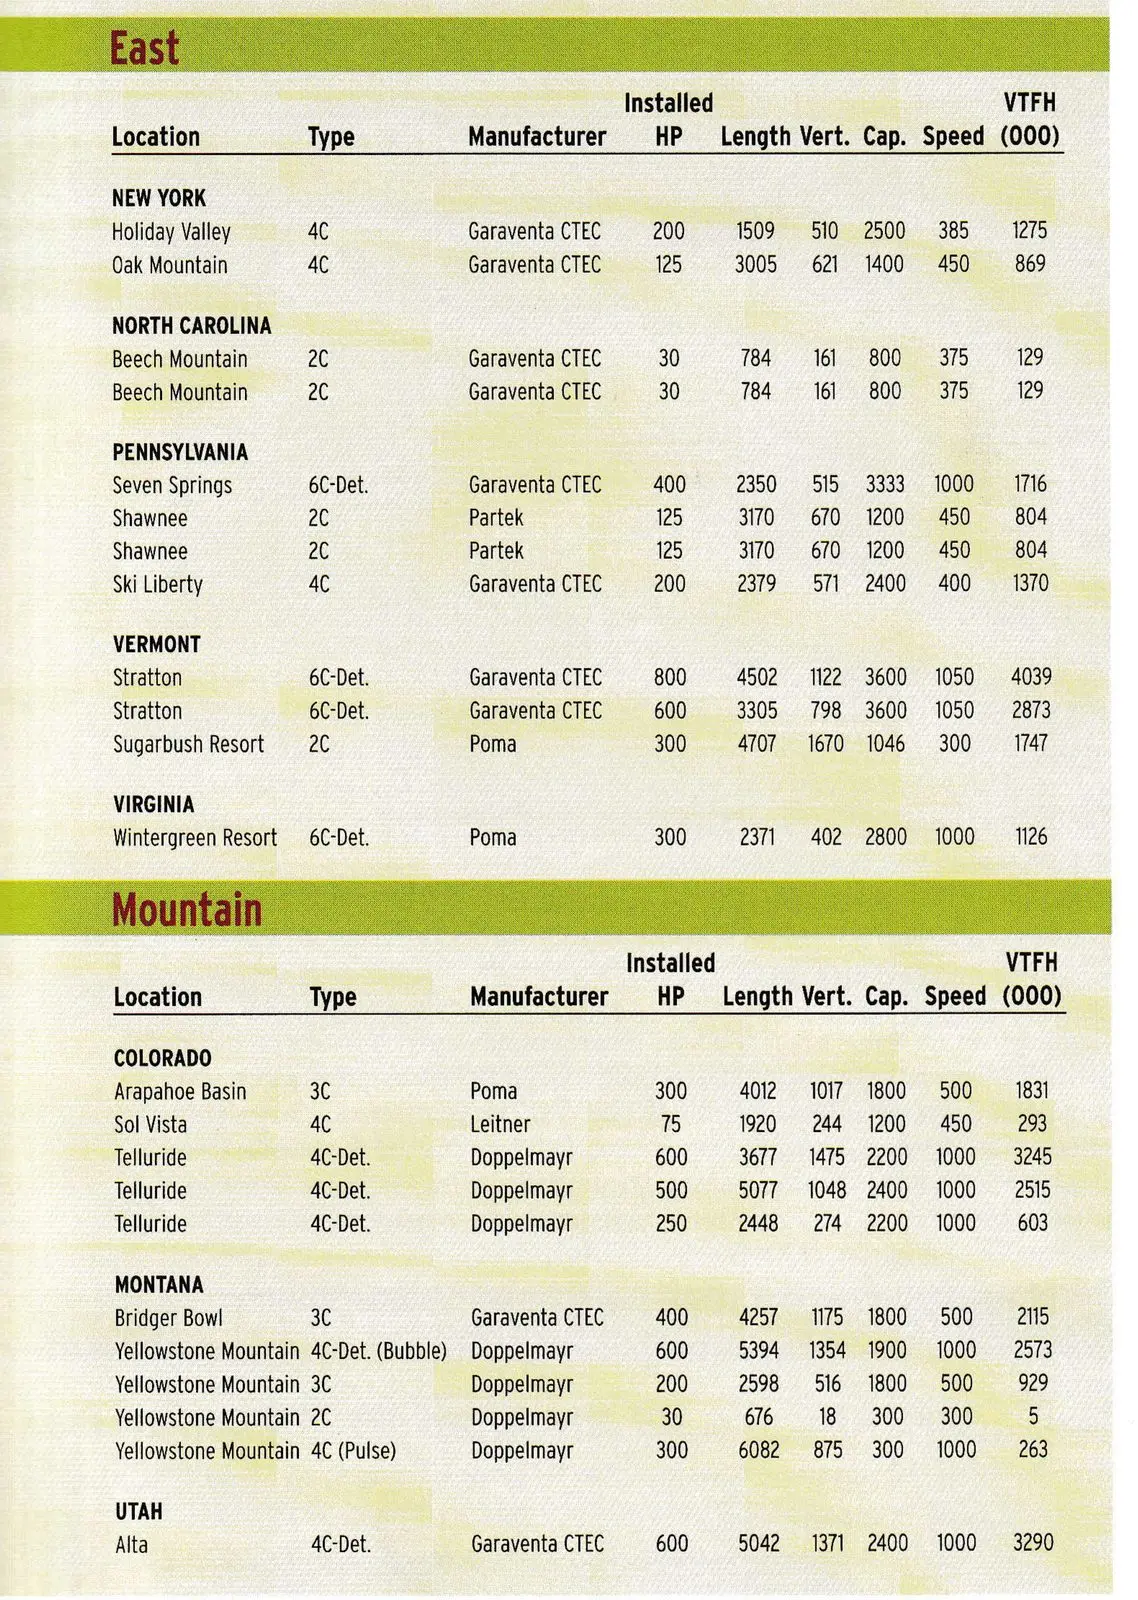
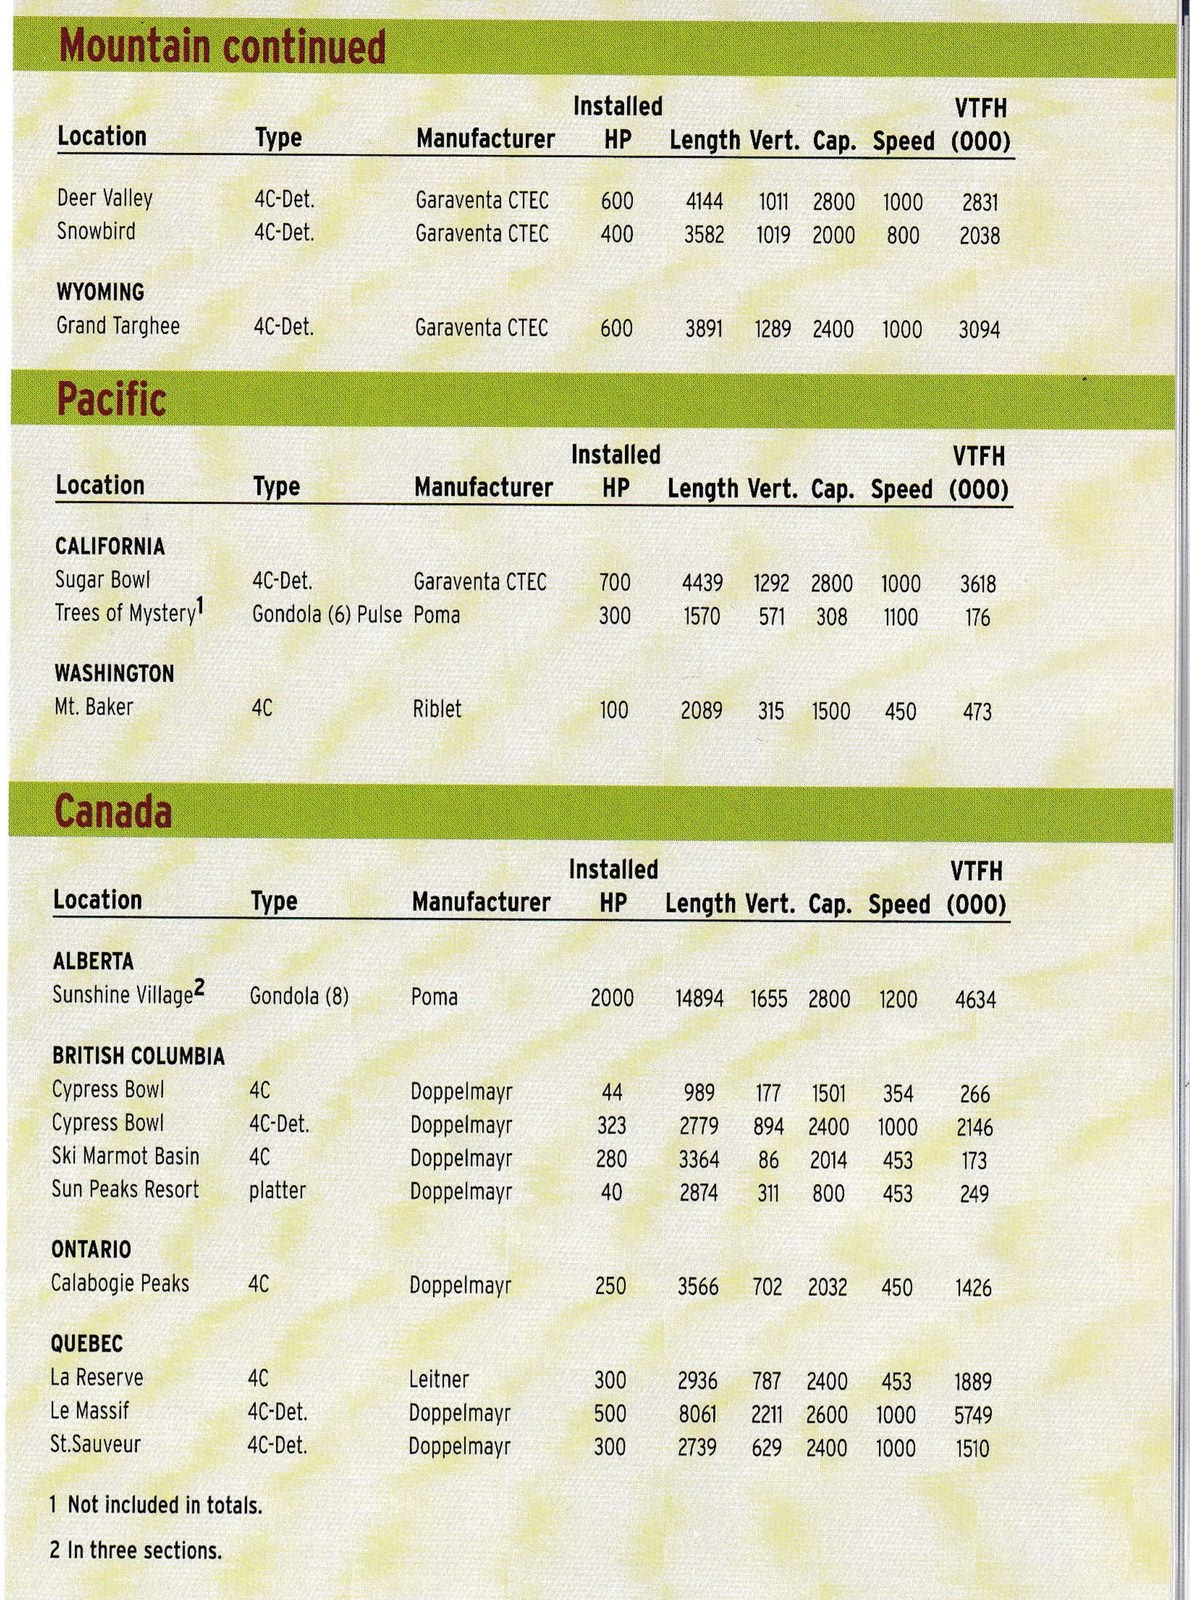
So, where was the damage done this year? Canada took a beating. Last year, Canada’s 21 new lifts gave it a whopping 42 percent of all new lifts and 34 percent of the new VTFH. What a difference a year makes, because this year’s nine new lifts meant 24.3 percent of the total and 27.9 percent of the VTFH. Interestingly, almost 60 percent of that new VTFH was in eastern Canada, thanks in part to Doppelmayr’s monster detachable quad at Le Massif, Quebec, which weighs in with 5,749 of VTFH—by far the largest of any of this year’s new lifts in North America, with 2,211 feet of vertical, an 8,061-foot length and capacity of 2,600. In fact, unless a reader can come up with a rival, we think this lift can claim to have the largest VTFH of any detachable quad in North America.
Perhaps the biggest shocker, though, was among the Pacific ski areas where only two new lifts were installed with a total VTFH of only 4,091—both figures representing 10-year lows and probably all-time lows. Putting the two new lifts into further perspective, the Pacific 10-year average is 9.3 lifts and the 10-year average VTFH for Pacific states is 22,235, more than five times this year’s total.
| Region | New VTFH | Surface | Chairs | Gondolas/Trams | Total |
|---|---|---|---|---|---|
| East | 16,881 | – | 12 | – | 12 |
| Mountain | 25,625 | – | 14 | – | 14 |
| Pacific | 4,091 | – | 2 | – | 2 |
| Canada | 18,042 | 1 | 7 | 1 | 9 |
| Totals | 64,639 | 1 | 35 | 1 | 37 |
| Region | 1992 | 1993 | 1994 | 1995 | 1996 | 1997 | 1998 | 1999 | 2000 | 2001 |
|---|---|---|---|---|---|---|---|---|---|---|
| East | 6 | 5 | 15 | 13 | 11 | 12 | 10 | 13 | 6 | 12 |
| Midwest | 3 | 3 | 1 | 4 | 1 | 10 | 3 | 4 | 2 | 0 |
| Mountain | 11 | 13 | 13 | 12 | 24 | 24 | 21 | 25 | 11 | 14 |
| Pacific | 9 | 9 | 9 | 5 | 10 | 9 | 17 | 10 | 10 | 2 |
| Canada | 7 | 11 | 13 | 7 | 7 | 6 | 13 | 11 | 21 | 9 |
| Totals | 36 | 41 | 51 | 41 | 53 | 61 | 64 | 63 | 50 | 37 |
| Manufacturer | Surface | Chair | Gondolas/Trams | Total lifts | Total VTFH |
|---|---|---|---|---|---|
| Doppelmayr | 1 | 13 | – | 14 | 21,652 |
| Garaventa CTEC | – | 14 | – | 14 | 29,386 |
| Leitner | – | 2 | – | 2 | 2,182 |
| Partek | – | 2 | – | 2 | 1,608 |
| Poma | – | 3 | 1 | 4 | 9,338 |
| Riblet | – | 1 | – | 1 | 473 |
| Totals | 1 | 35 | 1 | 37 | 64,639 |
| Region | 1992 | 1993 | 1994 | 1995 | 1996 | 1997 | 1998 | 1999 | 2000 | 2001 |
|---|---|---|---|---|---|---|---|---|---|---|
| East | 9,129 | 10,438 | 31,603 | 31,781 | 15,890 | 32,123 | 19,453 | 33,695 | 11,358 | 16,881 |
| Midwest | 3,083 | 1,556 | 866 | 1,069 | 95 | 5,929 | 2,185 | 4,373 | 1,070 | 0 |
| Mountain | 26,281 | 33,334 | 28,807 | 19,676 | 59,195 | 71,199 | 69,922 | 52,591 | 21,999 | 25,625 |
| Pacific | 21,675 | 18,817 | 22,645 | 11,916 | 28,549 | 22,088 | 46,357 | 17,952 | 28,521 | 4,091 |
| Canada | 16,420 | 10,856 | 24,034 | 15,430 | 16,444 | 15,232 | 28,265 | 22,142 | 32,424 | 18,042 |
| Totals | 76,588 | 75,001 | 107,955 | 79,872 | 120,173 | 146,571 | 166,182 | 130,753 | 95,372 | 64,639 |
Of course, worst of all in some ways is the Midwest total of zero new lifts; but since this was down from last year’s rather meager two lifts, the drop doesn’t seem quite as precipitous. The 10-year average for the Midwest is 3.7 new lifts.
The big news this year was from the Mountain states, which installed 14 new lifts, with 25,625 of VTFH, thereby scarfing up 40 percent of the continent’s total. Colorado’s Telluride led the pack with three Doppelmayr detachable quads, while in Montana, the Yellowstone Mountain club operation added three chairs and a detachable quad with bubbles. But the most muscular of the new lifts in the Mountain states were the Garaventa CTEC detachable quads in Utah (three) and Wyoming (one). These four added a total of 11,253 in VTFH, or 44 percent of the region’s total.
Returning to the East, seven of the region’s 12 new lifts were in the southeastern banana belt. Pennsylvania alone added four, (what a difference a good snow year makes!) while in the Northeast, Intrawest splurged with two big Garaventa CTEC six-packs at Stratton. On the 10-year average perspective, the East was slightly ahead of the 10.3 new lifts per year, but the 18,042 of VTFH is somewhat below the 21,235 average.
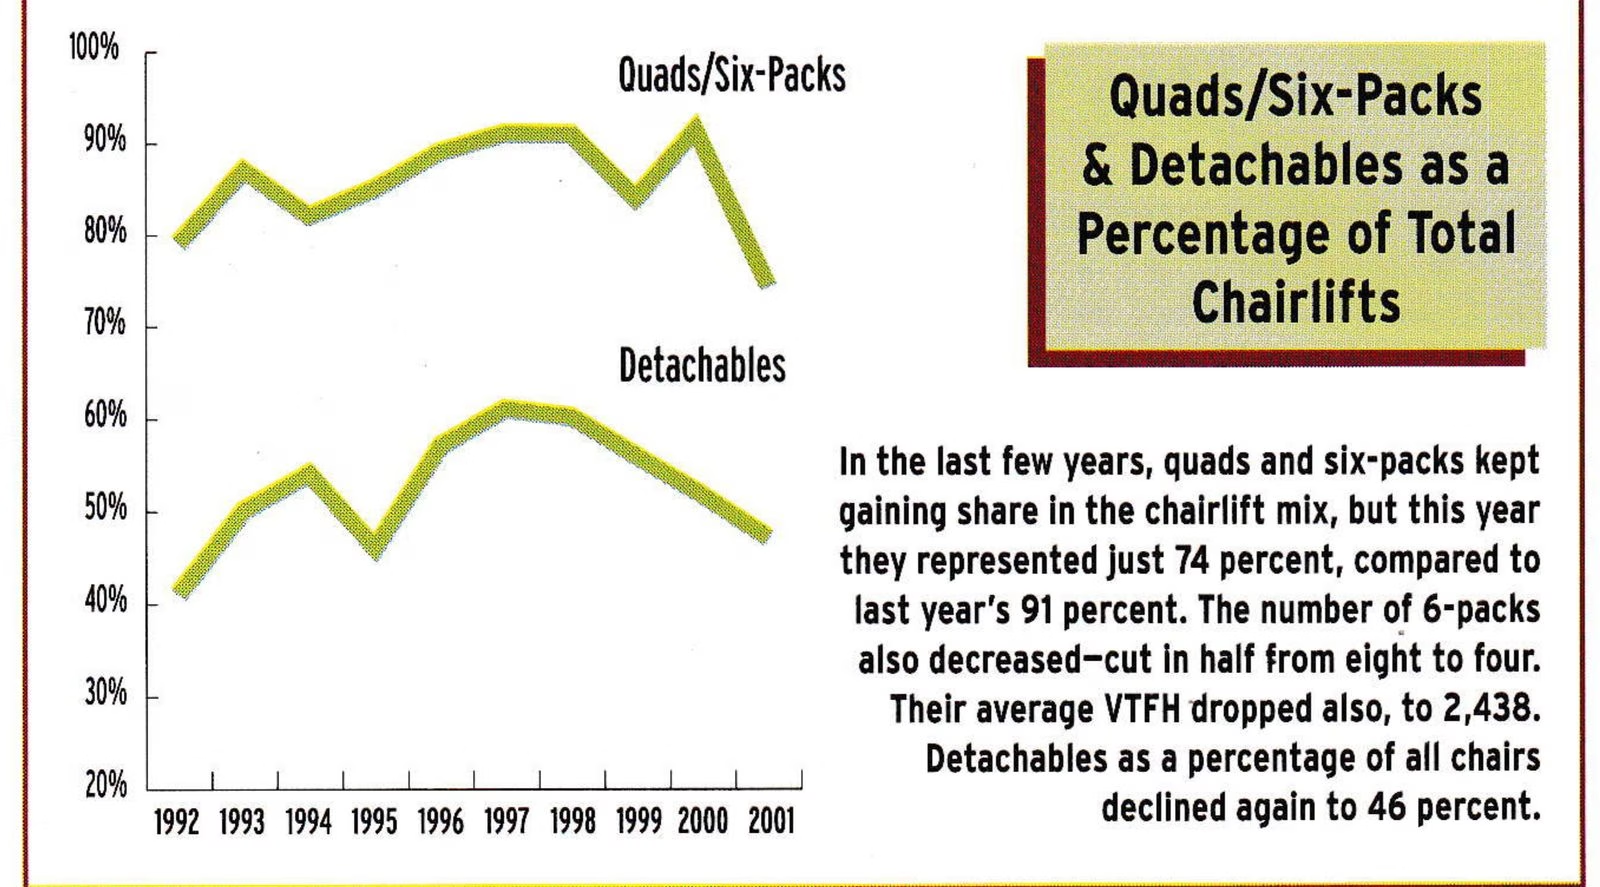
Looking at the distribution of types of lifts, of the 35 chairlifts installed, 19 were fixed-grip and 16 detachable. Of all chairlifts, an overwhelming 22 were quads, four were six-packs, six were doubles and three were triples.
Last year, quads and six-packs accounted for 91 percent of all chairlifts; this year the percentage dropped to 74. Last year, detachables as a percentage of all chairs stood at 51 percent. This year the percentage dropped to 46 percent.

The Ballad of VTFH
We think you really ought to know
(For SAM has yearly told you so)
That Vertical Transport Feet per Hour
(When big we smile, when small we glower)
Just measures the work a lift can do
By counting the passengers,
many or few,
Who travel a thousand vertical feet
In sixty minutes. Now we repeat:
You multiply those vertical feet
By people per hour (we call it capacity).
And now go bask in your sagacity.
How did the manufacturers share in this year’s modest production? The big three finished in the same order: Garaventa CTEC just ahead in both units and VTFH of Doppelmayr, with Poma in third place. The numbers for everyone are down, however. This paragraph, by the way, will look very different next year when the mergers between Doppelmayr and Garaventa CTEC and between Leitner and Poma may present strikingly new share-of-market patterns.
As always, much of what the skiing public enjoys as “new” results from upgrades, relocations and re-engineerings of existing lifts. So, for example, this winter’s skier at Powder Ridge in Connecticut will delight in a “new” triple, which, for our records, is a major re-build by Partek, but not new.
We have noticed a lot of electrical upgrades reported. For instance, Poma did extensive electrical upgrades on five Colorado lifts, including four detachables. Ditto for Leitner at Bromont, Quebec and Angle Fire, N.M.
It turns out to have been a strong year for the other types of snowsport uphill devices. The conveyor belt/carpet category increased again—this year from 30 to 37, for a 23 percent increase. Word is that most instructors are enthusiastic about them for teaching kids.
In the handle and tubing tow category, the total numbers were down, but that’s not nearly as significant as the surge in tubing tows. Last year we were impressed by a count of 19 tubing tows; this figure has soared even more impressively to 34. More and more areas are finding gold in their tubing operations.
So, the 2001 lift construction year is now history. We like to think it will make next year’s total look really good!
| Manufacturer | Total |
|---|---|
| Harusch | 4 |
| Leitner | 1 |
| Multi Skilift | 17 |
| Schippers | 4 |
| Star Lifts** | 22 |
| TOTAL | 48 |
| Manufacturer | Total |
|---|---|
| Magic Carpet | 12 |
| Schippers | 3 |
| Star Lifts | 22 |
| TOTAL | 37 |