The ski area industry, by any measure, is not showing returns commensurate with the risks involved. Average operating profit was only 7.6% of Gross Fixed Assets over the past four seasons—a span that included the best and worst seasons at a majority of the ski areas. While there are numerous instances of individual ski areas continually showing returns that fully compensate for the risks, the average performance is dismal. There are many reasons for this, ranging from poor concepts, to overcapitalization, to mismanagement, to pricing policies. Note that the weather is not listed, since a properly conceived ski area should be designed to compensate for the weather. The ski industry must earn average returns that are adequate through good and bad seasons alike.
While the control over ski lift ticket prices is debated between the public and private sectors, the basic approach to developing a logical and acceptable price is the same whether accomplished by a series of separate, private, business decisions, or by a public hearing administrative review approval process. In simple terms the producers must receive a total revenue adequate to cover all costs, including a return commensurate with the risk, while the consumer must be offered a price that equates with his concept of the value of the service. Thus pricing for survival involves determining: 1) What is value to the skier? 2) What is the cost to the ski area operator? 3) How do the two match up?
Value to the Skier
Value is created by need, utility and scarcity. Value includes the concepts of form, place and time utility. There is no question that there is a need for skiing opportunities. The continued pressures placed on properly conceived ski areas when ski conditions are good attest to the continued strong demand for recreational skiing. The concept of “utility” includes Form (the terrain, layout, facilities and environment); Place (convenience to the skier); and Time (convenience to the skier’s work/play schedule). The concept of scarcity, heretofore not applicable, may well become primary in the years ahead, as demand continues to outpace supply. The value of the skiing experience to the skier is a combination of these basic factors. Although skiers might have difficulty identifying their basic motives, students of human behavior know that people are willing to pay for “value”, and further that their subconscious measure is that they are not “ripped off.”
Most ski areas price based upon their perception of form utility. Thus Aspen and Vail, with the large mountains, variety of trails, and generally dependable snow conditions, set the upper price limit. The local ski area operator with less of a mountain (Form utility) perceives his product as having less value. Yet the skier will have to pay a great deal more to travel to the remote mountain, including transportation and accommodations. Surely “Convenience” merits some consideration in arriving at value. The concept of time utility, on the other hand, is generally valued, since the principle of differential weekend and mid-week prices is firmly established.
This concept may be illustrated in principle, and in a simplified way, to show that if indeed the vacation destination ski areas are truly a $13 value (and continued high utilization supports this observation) then the convenient, local, weekend ski areas may be of equal value.
| Vacation Resort | Local, Weekend | |
|---|---|---|
| Form utility | $ 20.00 | $ 3.33 |
| Place utility | (10.00) | 3.33 |
| Time utility | 0.00 | 3.33 |
| Total value (price?) | $ 10.00 | $ 10.00 |
This theory may be individually tested by using the principle of the elasticity of demand. In short, it determines the point where the price/volume relationship yields the greatest revenue. Value is then determined by the market. In general, ski lift prices have not reached a level where this principle has been observed at work. As a simplified illustration:
| Average lift ticket revenue/skier-visit | Actual Skier-visits | Total lift ticket Revenue |
|---|---|---|
| $ 8.00 | 100,000 | $800,000 |
| $ 9.00 | 90,000 | $810,000 |
| $10.00 | 80,000 | $800,000 |
The $ 9.00 level is the point of greatest elasticity.
Cost to the Ski Area Operator
Ski areas are capital intensive businesses. Thus costs / skier-visit are highly sensitive to the volume of skier-visits. This relationship is best illustrated using a break-even analysis. Break-even modeling is an extremely useful tool for testing many proposals from pricing to expansion.
The break-even chart shown (next page) models ski area economic characteristics. While there are local and regional differences in construction and operating costs, the model can be adapted to any ski area. This example represents a very typical operation. While the ski area is fictitious, the economic parameters have been constructed from data gathered for the 1975-76 “Economic Analysis of North American Ski Areas.”

This model is based upon the following design characteristics, which are the basis for developing the cash operating cost levels at various skier-visit (utilization) levels: 1) A skier capacity of 2,500 skiers; 2) A ski season of 128 days; 3) An investment of $3,750,000; 4) A cost-of-capital equal to a 20% annual cash return on the investment—an operating profit of 14% of Gross Fixed Assets.
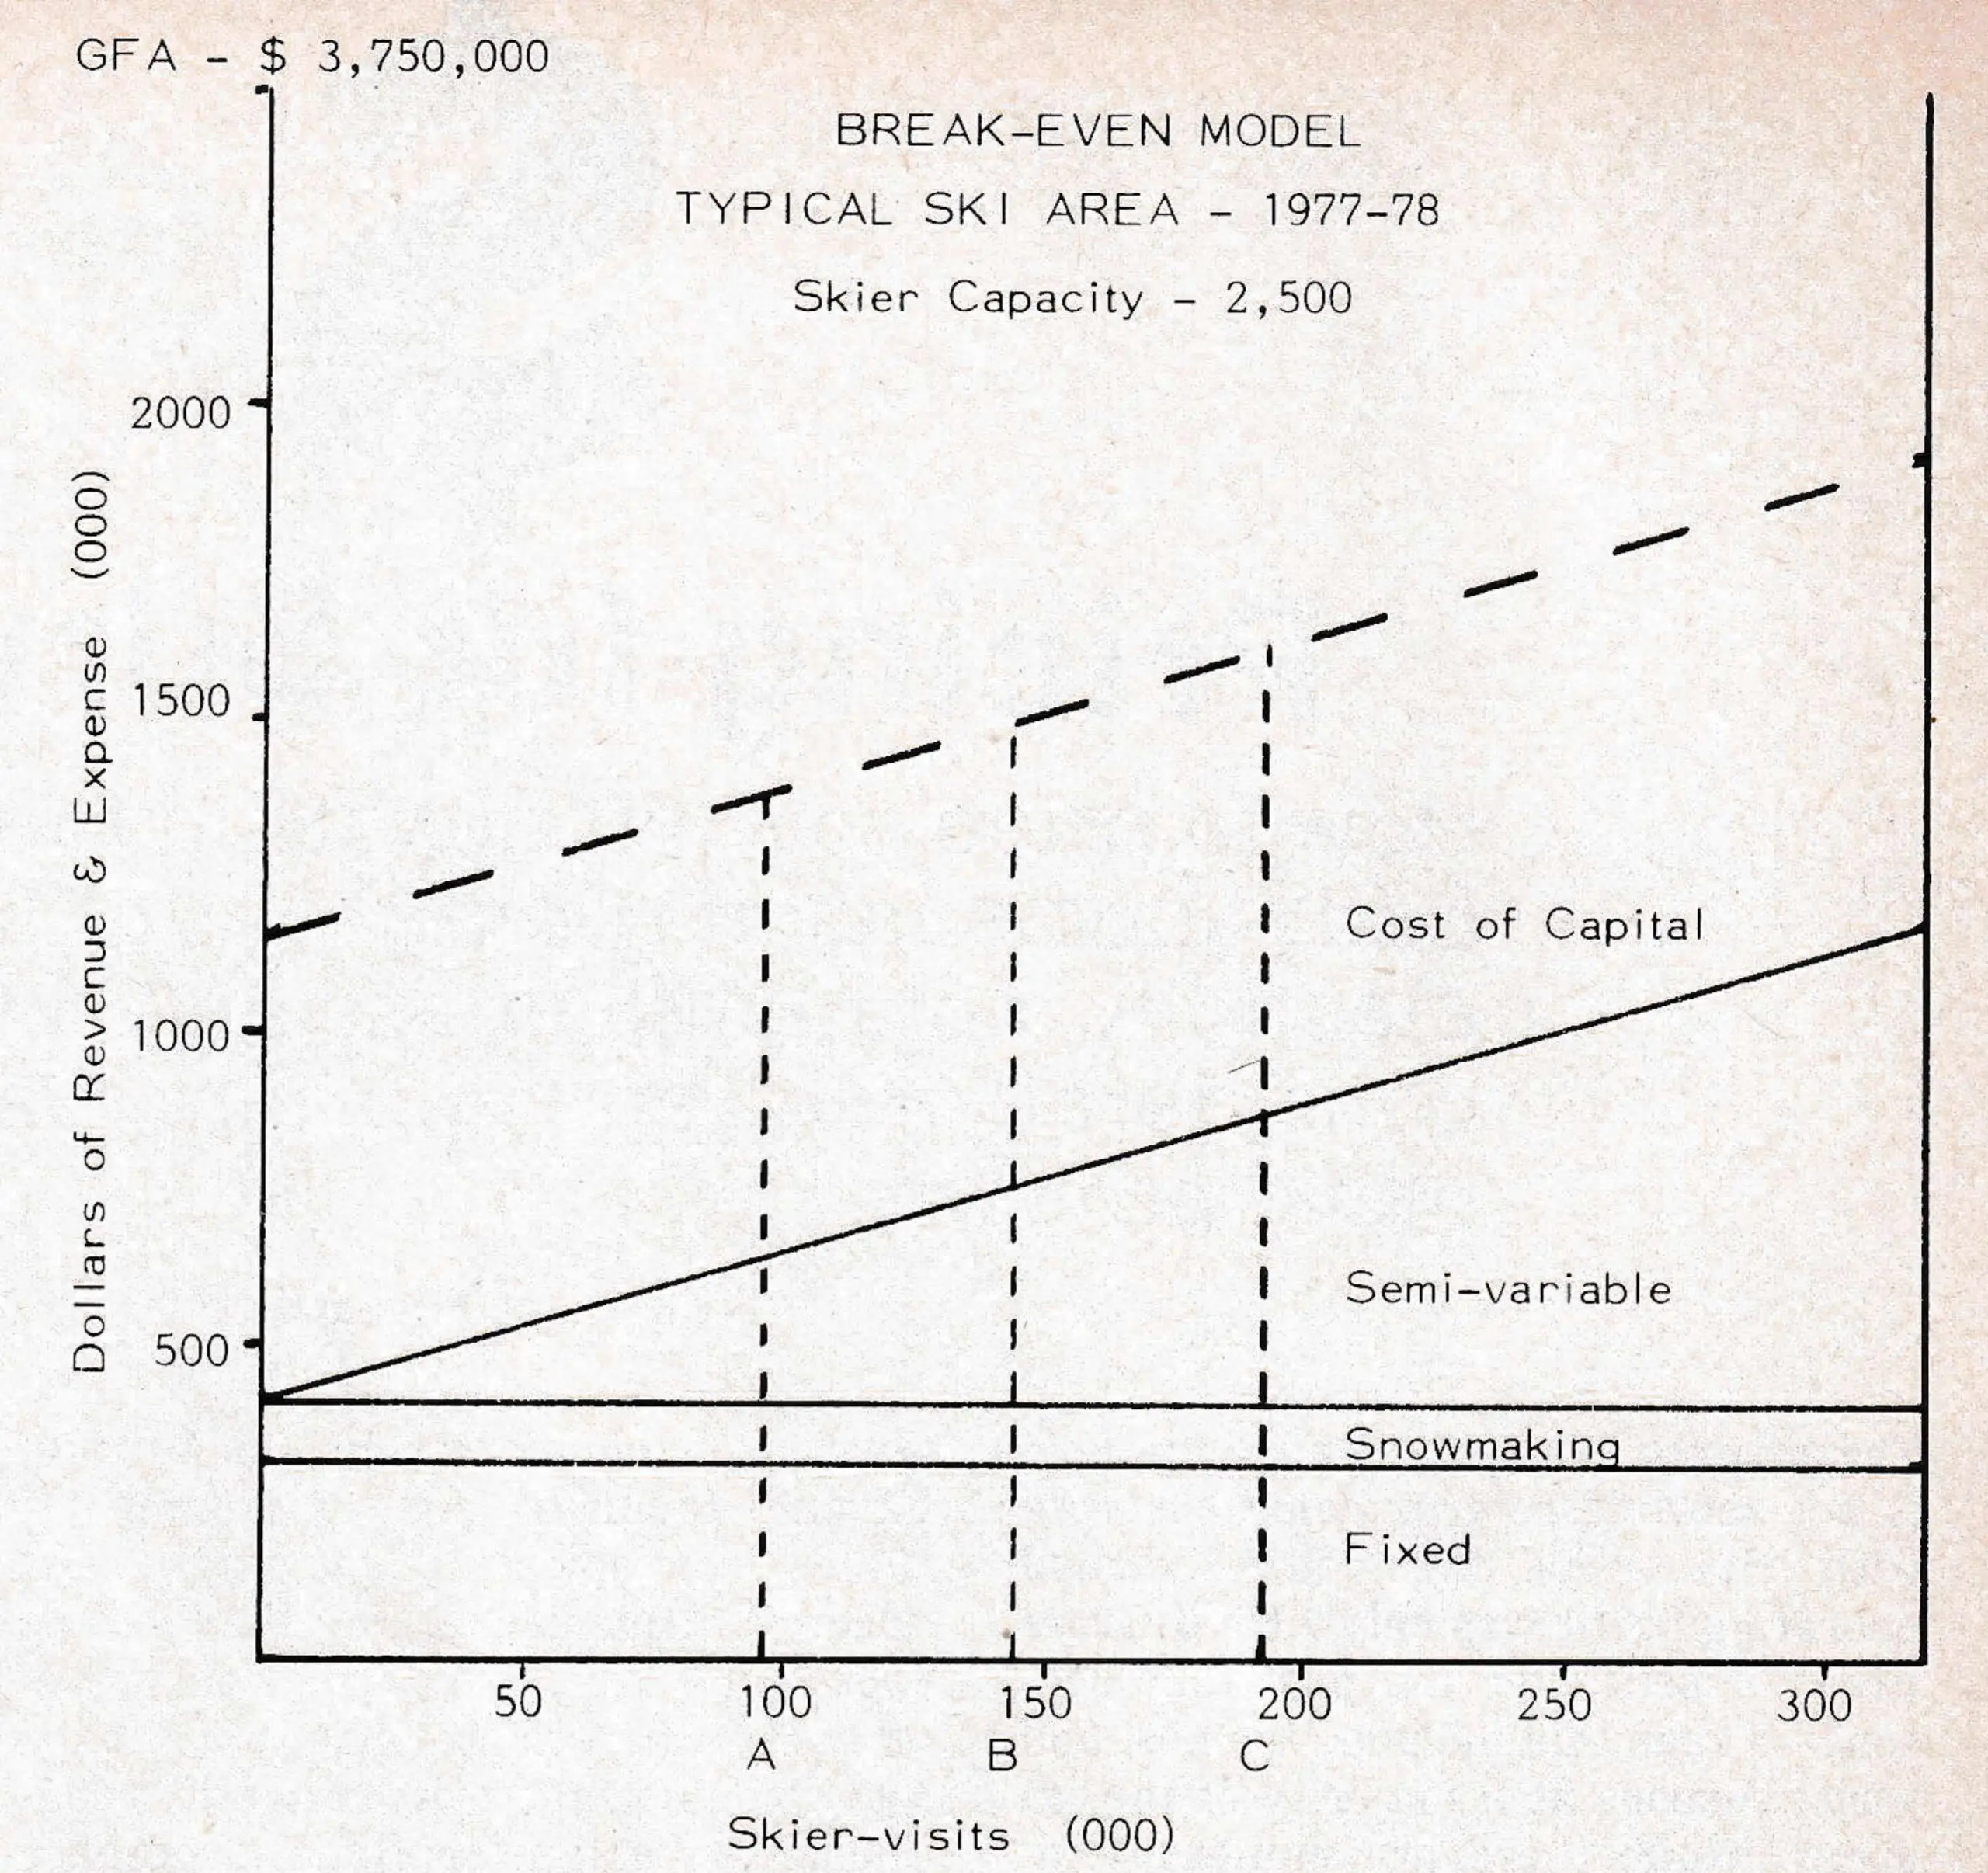
This is a well-balanced model, with a reasonable investment per skier ($1,500); snowmaking to support a relatively long season; with skier densities at 20/acre on natural snow, and 40/acre on machine coverage. In general, cash operating costs are a function of the size of the ski area, the length of the operating season, and the utilization level. This model plots the expected level of costs at various levels of utilization. The three cash costs illustrated are the fixed costs (for marketing property insurance, property taxes, general and administrative expenses); the special added fixed costs for snowmaking; and the semi-variable costs (for operating salaries and wages, supplies, maintenance and energy). Research reveals a rather stable and predictable relationship between these semi-variable costs, the ski area’s capacity skier-visits and utilization. Thus these cash costs increase with an increase in utilization. The final cost is the target 20% return on invested capital. Thus the upper dashed line is the revenue goal at each level of utilization.
The question now becomes, what lift ticket price is required to cover these costs? The answer ranges from $16.00 to $8.50, and is now entirely dependent upon the level of utilization. Table 1 covers the range of probabilities from a 30% to a 60% utilization. Points A, B, and C on the chart illustrate three selected utilization levels. The direct revenue per skier-visit must be adjusted to allow for a projected operating margin from supporting ski school, food and beverage, shop and equipment rental operations, and to reflect two additional variable expenses. On the average, ski areas experience a cost amounting to 6% of revenue for liability insurance and land use fees. In addition, the norA mal discount plans for mid-week, season’s pass, children, etc. means that the average lift revenue per skier-visit is only 80% of the published weekend, adult ticket price.
Since the average ski area operates at about 45% of capacity, the survival price level for the example should be at $11.00. Thus, in lean years, if utilization dropped to 40%, this ski area would show inadequate returns, to be recovered in good years, when utilization climbed to 50%. However, a basic survival question remains: How does the ski area with an average annual utilization of 30% price?
| POINT | A | B | C |
|---|---|---|---|
| Expected Utilization | 30. | 45. | 60. |
| Skier-visits (000) | 96 | 144 | 192 |
| Required Revenue (000) | $1,400 | $1,515 | $1,628 |
| Revenue/Skier-visit | $14.60 | $10.52 | $8.48 |
| Less: Variable expenses | (.83) | (.60) | (.48) |
| Supporting margins | (1.19) | (1.19) | (1.19) |
| Average lift revenue/skier-visit | $12.58 | $8.73 | $6.81 |
| Required, Adult, Weekend Ski Lift Ticket Price | $15.73 | $10.92 | $8.51 |
Matching Cost and Value
There is no fool-proof, double-your-money-back guaranteed method of setting prices. While there are mathematical models that illustrate the complex relationships between the critical variables, the final decision involves a trial and error process to find the balance between cost and value. The strength of the marketplace model is that the rewards for putting together the right combination, justify the risks of failure.
Current national statistics show that ski area costs per skier-visit at average expected utilization, now exceed the current price level. Thus, in general, the ski industry must either increase prices at a rate that exceeds the loss in dollar value that is caused by inflation, or increase the average level of utilization. The price of ski lift tickets has not kept pace with inflation. The ski industry has survived mainly because utilization has been steadily climbing. The $11.00 average lift ticket, at 45% average utilization is a good goal. However, it is 112% of the current estimated 1977-78 average of $9.80. When this intelligence is combined with the observation that the ski lift ticket has not reached the point of elasticity, the strategy must be to aim at closing the gap. This is not to say that the pricing policy for all ski areas should be to increase. Some areas are already on target, some might achieve greater revenues by decreasing prices, some might close the gap by minimizing discount plans, and some might find it necessary to write off an overcapitalized plant to survive.
Let us hope, however, that the pricing decision remains in the marketplace. Its current complexity tests the skills of ski area operators, without also compounding the situation by adding political/bureaucratic decision-making machinery.