


Dramatic improvement best describes the financial performance of the 2000-2001 ski and snowboard season. Uniformly good snow at the right time across virtually the entire country produced an all-time record high 57.3 million skier visits for the nation. Good snow also produced a lengthening of the season in all regions of the country for a national average of 10 days, which contributed to the increase in skier visits. These operating conditions resulted in a consistently good financial performance in all regions and across all resort size categories. The strong 2000-2001 season represented a major contrast to the 1999-2000 season when marginal snow conditions in many regions led to earnings that ended well below the annual average for the industry.
The study was prepared by the National Ski Areas Association (NSAA) in conjunction with RRC Associates of Boulder, Colo. As in the past, two-year comparisons are provided for all data. Only resorts that provided complete financial data for both the 2000-2001 and the 1999-2000 seasons were included in the report to ensure validity when comparing the results from year to year. The basic reporting format has not changed from that of the previous reports and all results are arranged by overall national totals, by regions, by the size of the resorts as measured by vertical transport feet per hour (VTFH) and then by size within the different regions. This year the authors added questions concerning the number of employees (seasonal and year-round), providing a measure of the impact the ski industry has on employment. The data also provides for the calculation of ratios such as revenue per employee and skier visits per employee.
The report contains information from 99 ski resorts across the United States. These 99 respondents represented about 33.5 million skier visits, or about 58 percent of the national total. The average annual skier visits for the participating areas was 338,545, which is above the national average, thus the average size of resorts participating in the study is larger than the overall industry average.
2000-2001 vs. 1999-2000 Results
- Profit before taxes increased to $1,416,000 from $57,000, an increase of 2,384 percent. This impressive increase certainly underscores the effects of the dismal conditions of the 1999-2000 ski season.
- Average operating profit grew to $4,534,000 from $3,229,000, up 40.4 percent.
- Operating profit on gross fixed assets recorded an increase from 9.6 percent to 12.1 percent.
- Average gross revenues at resorts climbed from $17,437,000 to $19,973,000, increasing 14.5 percent.
- Before tax cash flow increased from $2,163,000 to $3,531,000, up 63.2 percent.
- The average length of the season was 10 days longer than the previous season, increasing from 127 days to 137 days.
- Average revenue per skier visit recorded a slight decline of 1.2 percent falling from $59.70 to an average of $59.00.
- Average lift ticket revenue increased from $27.29 to $27.36.
- Overall average ticket yield as a percentage of the average weekend adult price was 62 percent, a slight drop from 64 percent the previous season.
- The average expenses resorts saw per skier visit declined from $59.50 to $54.81, a drop of 7.9 percent.
- Average vertical transport feet per hour increased from 14,154,000 the previous season to 14,427,000 in 2000-2001, a hike of only 1.9 percent.
- The average number of resort skier visits was 338,545, up 11.6 percent, mainly because small- to average-sized resorts benefitted from longer seasons.
Profitability of Resorts
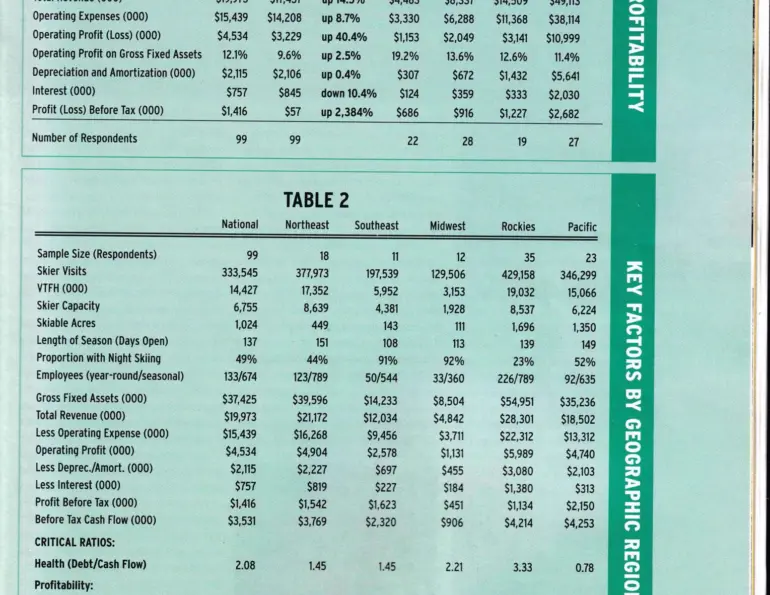
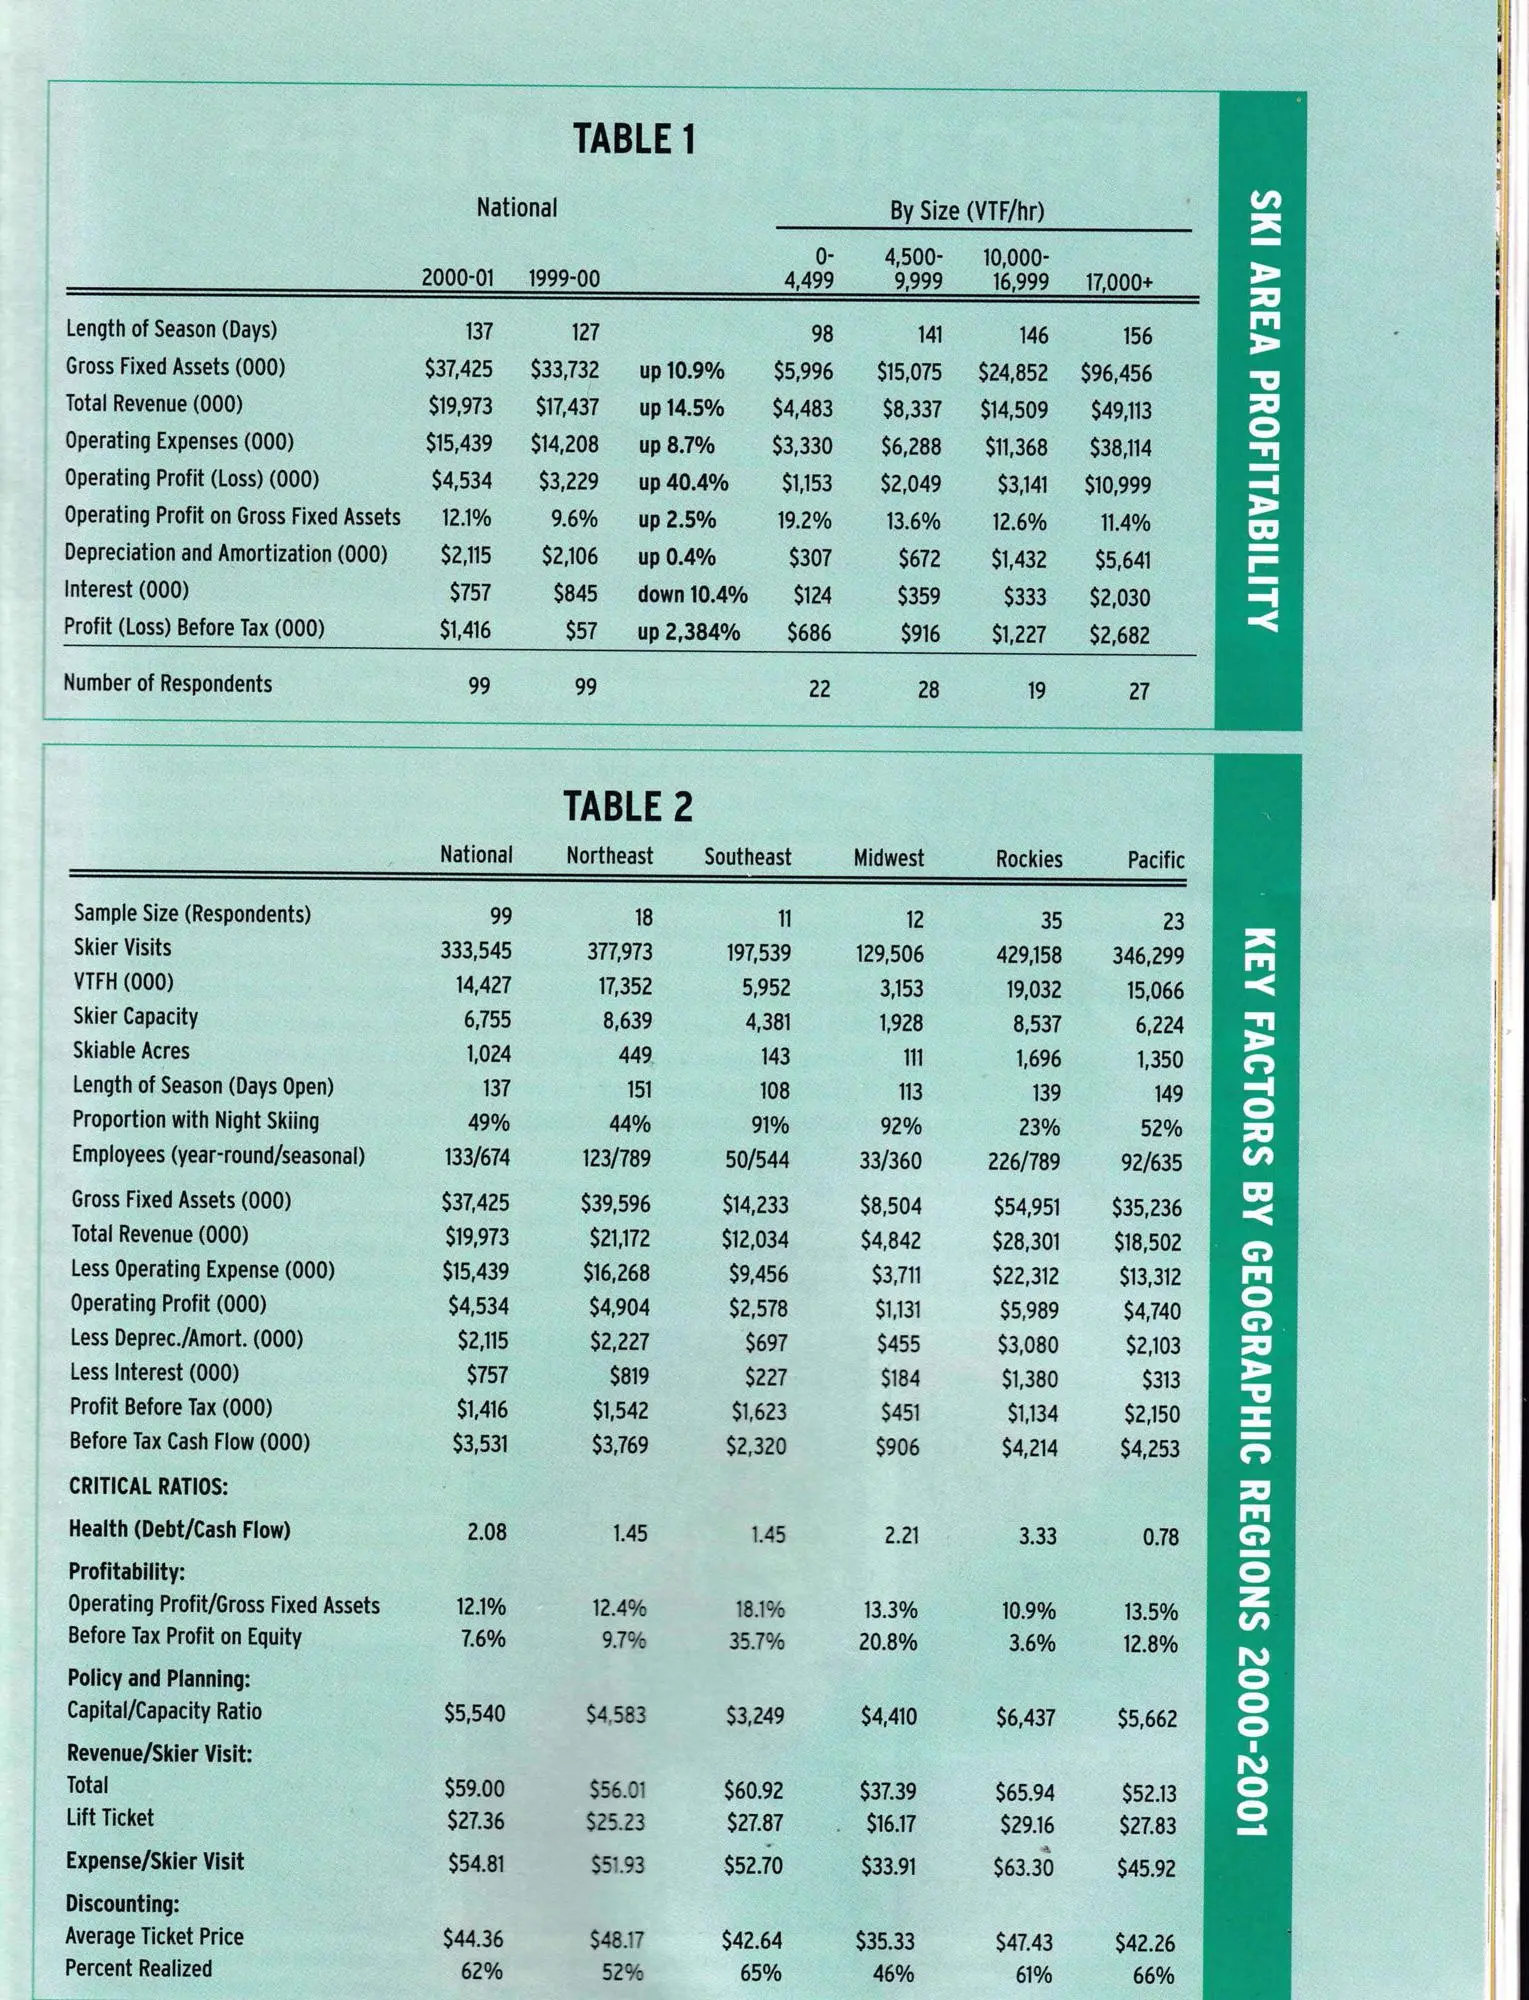
The study reports profitability at resorts several ways. It provides figures on operating profit before amortization and depreciation, interest and taxes and shows profits earned before tax. These measures are averaged for the total sample as shown in Table 1 and by region in Table 2. Table 1 shows that the largest resorts had an impressive operating profit […] smallest resorts recorded the highest operating profit on gross fixed assets of 19.2 percent. The smaller mid-sized areas (4,500-9,999 VTFH) recorded 13.6 percent, the larger mid-sized resorts (10,000-16,999 VTFH) recorded 12.6 percent, while the largest recorded 11.4 percent.
When considered by region, the relatively small areas of the Southeast recorded the best operating profit on gross fixed assets of 18.1 percent. They were followed by the Pacific region, which came in at 13.5 percent. In contrast to popular opinion, well-managed small ski areas do very well financially—achieving better margins than the larger areas and will be a part of the industry over the long term.
Regional Numbers
The average data by region found in Table 2 provides a picture of performance. Readers will observe that it removes the dominance and impact that combining the number and average size of the Rocky Mountain areas has on the […] Average visits were highest in the Rockies region with 429,158; followed by the Northeast with 377,973; the Pacific West with 346,299; the Southeast with 197,539 and the Midwest with 129,506.
Double-digit growth in total revenue […] Rockies showed the highest average gross revenue at $28,301,000. They were followed by the Northeast at $21,172,000, Pacific at $18,502,000, Southeast at $12,034,000 and Midwest at $4,842,000. [Total revenue per skier visit ranged from] $37.39 in the Midwest region to $65.94 in the Rockies region, and the yield on tickets varies by region with the Pacific region earning the best yield at 66 percent. The lowest was the Midwest at 46 percent.
Operating profit jumped by double-digit percentage increases in all regions. Pretax profit was highest in the Pacific region with an average of $2,150,000, the Southeast was second with $1,623,000, followed by the Northeast with $1,542,000, the Rockies with $1,134,000 and the Midwest with $451,000.

Employment
For the first time the study asked for the number of seasonal and year-round employees at the area. Nationally, resorts average 807 employees with 133 working throughout the year and 674 who are seasonal employees. As would be expected, the Rockies region reported the most employees (226 year-round, 789 seasonal) followed by the Northeast (123 year-round, 789 seasonal), Pacific (92 year-round, 635 seasonal), Southeast (50 year-round, 544 seasonal) and the Midwest (33 year-round, 360 seasonal).
Summary
Concerns facing the industry are that discounting continues at a vigorous rate, probably contributing to the flat revenue per visit experienced over the last two years. It is even more of a concern when it becomes clear there have been efforts to increase this figure over the last two decades. It begs the question whether a plateau has been reached.
Despite the overall success of the industry in 2000-2001, as usual there were pockets where some resorts struggled. In particular, a regional view shows that the Southeast and Northeast slipped somewhat in total revenue per skier visit while the Pacific resorts incurred increased expenses per skier visit.
The good snow and solid financial performance of the 2000-2001 ski season was just what the ski industry needed after two years of unfavorable conditions. Skier visits climbed to a record level of 57.3 million and profitability returned. The season demonstrated once again that snow conditions are the most critical variable affecting the industry’s performance. And while large areas produced greater dollar profit, the smaller areas were more efficient in turning revenues into bottom line profits.
Find All the Results
The 2000-2001 Economic Analysis of United States Ski Areas is the 33rd such report published by NSAA. It contains more than 100 pages and 50 tables describing the financial state of the industry. Copies may be obtained from NSAA, 133 S. Van Gordon St., Ste. 300, Lakewood, CO 80228; (303) 987-1111. Price for NSAA members is $200; for others, $400.