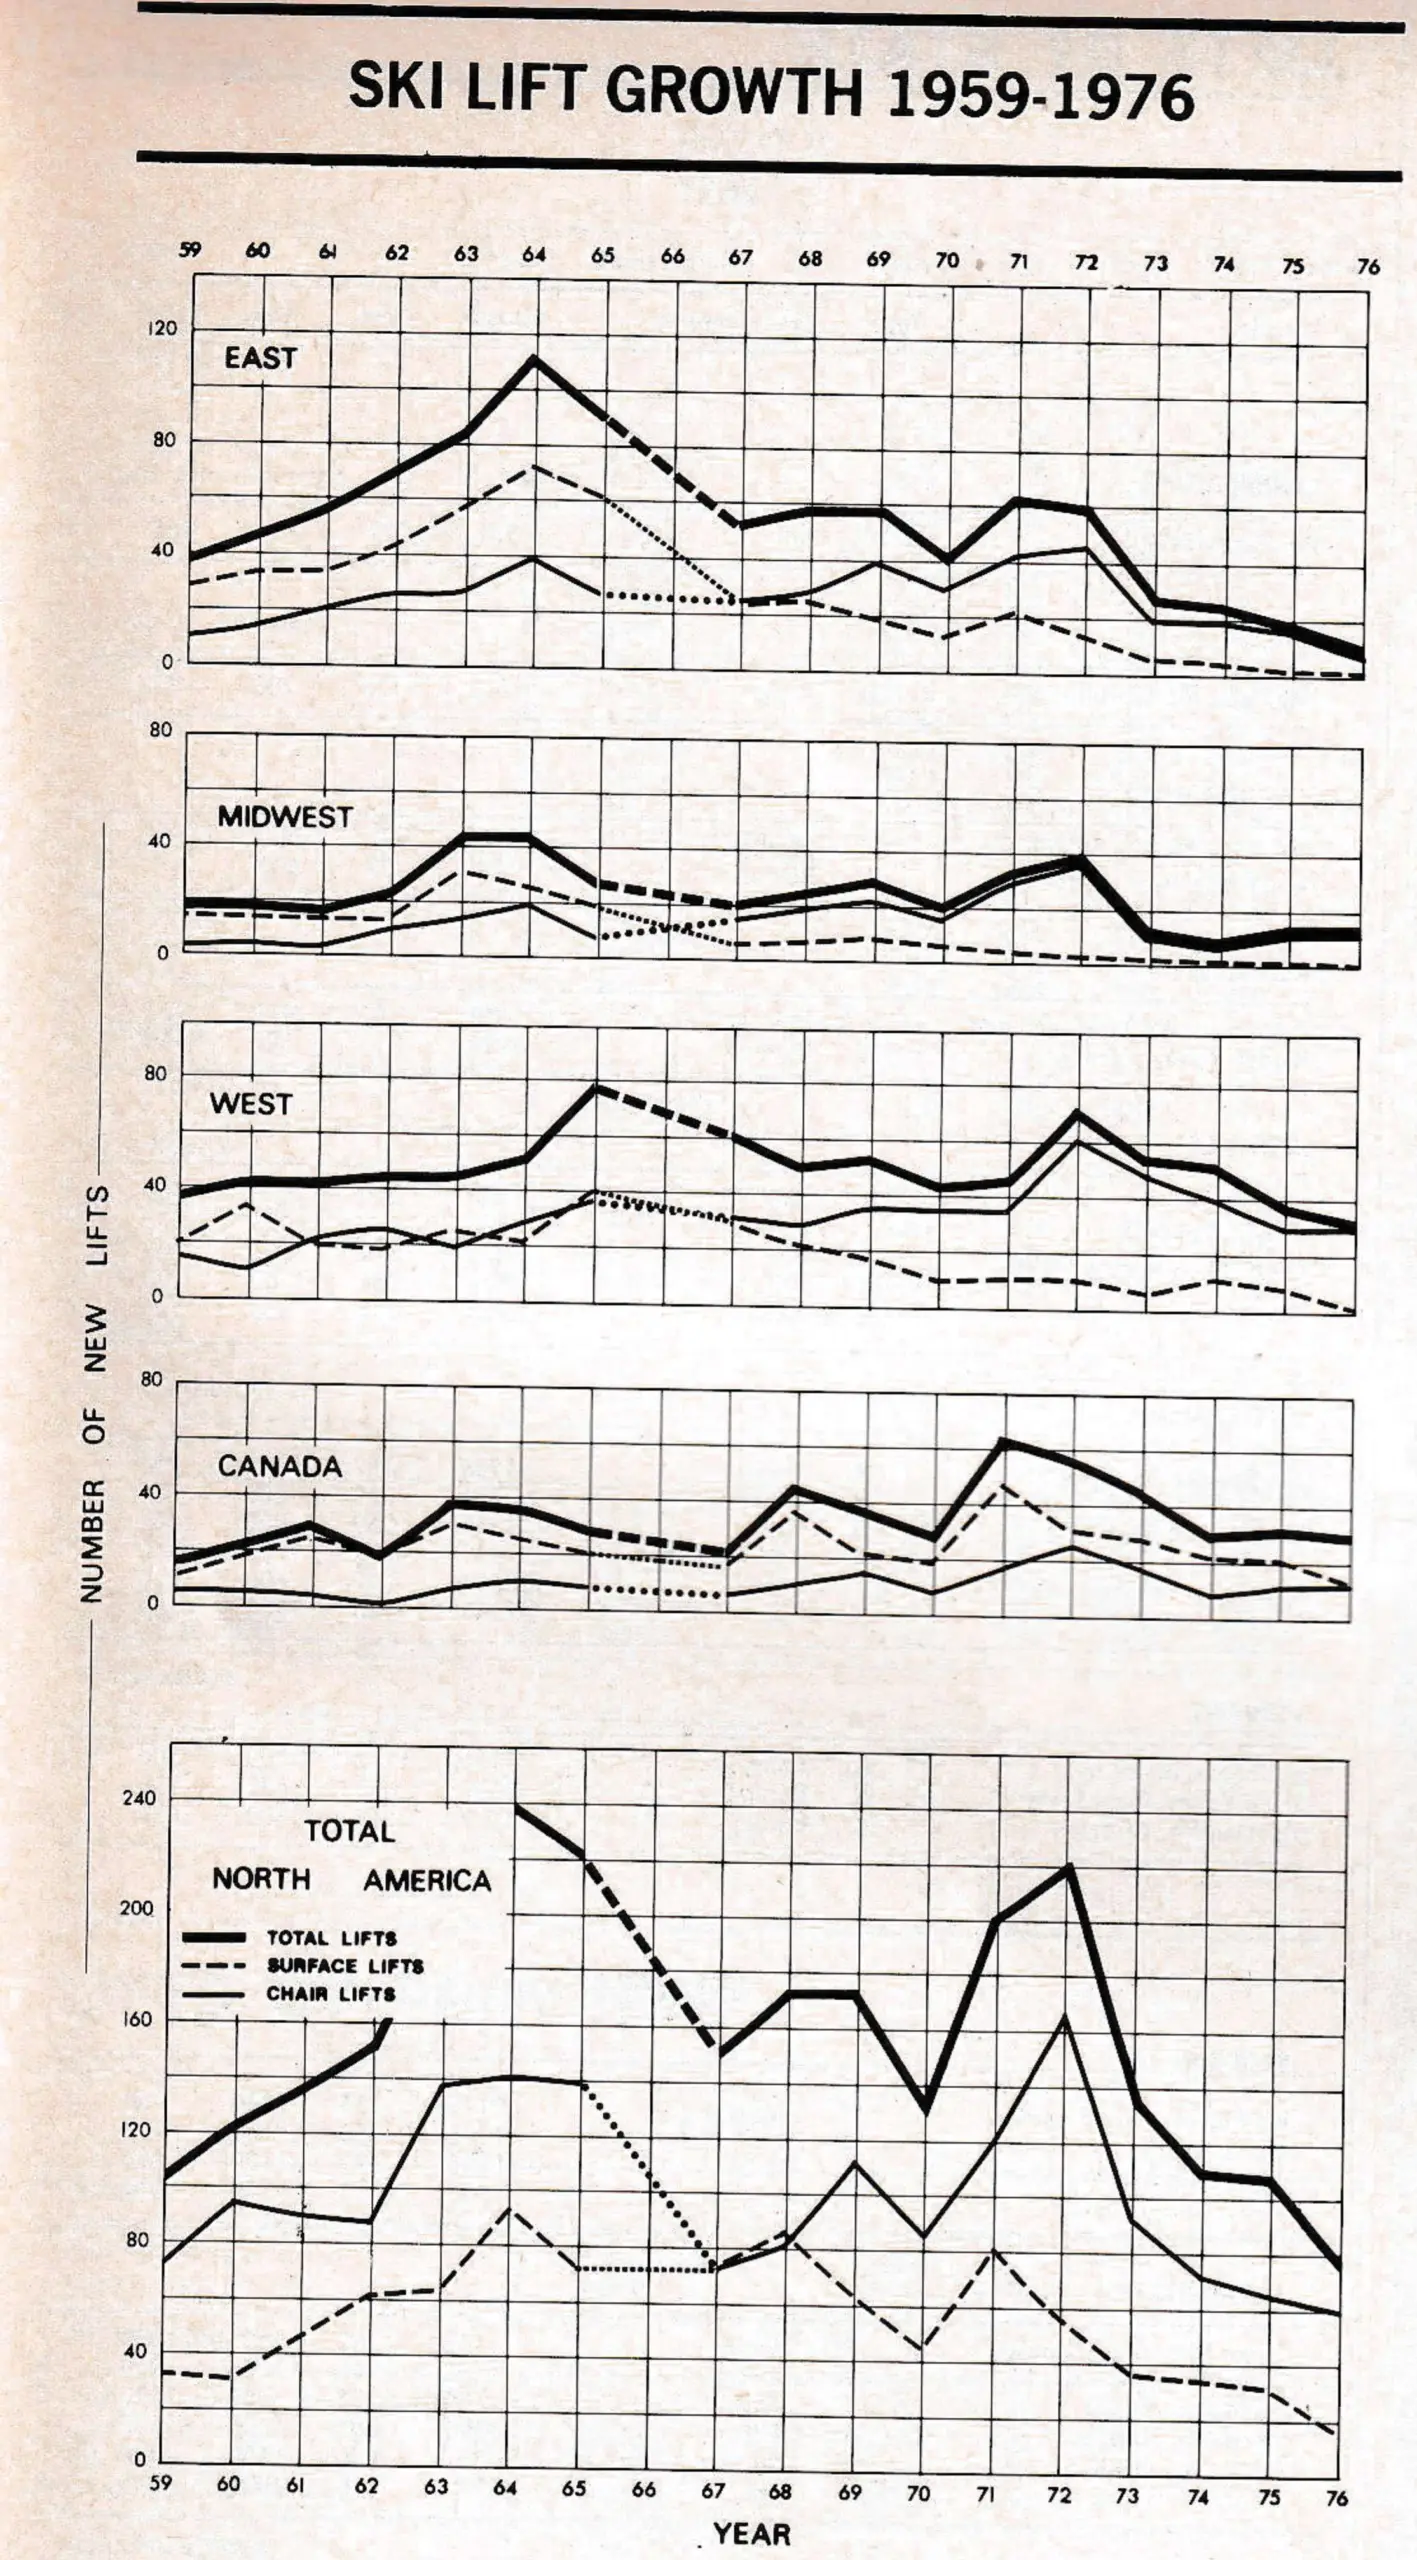
New lift construction in 1976 was down—down to 78, the lowest since 1957 when 77 were installed. To match the number of new areas (five, of which four were in Canada), you have to go back to the years of World War II. To ram it all home, consider the vintage years: 1964, when 239 new lifts were installed and 77 new areas were born. Or 1972, when 220 new lifts went up and 35 areas saw the light of day.
But, we’re living in the present, and a whole new set of environmental and fiscal constraints apply. Measured against last year, for instance, it doesn’t look too bad: despite a 19 per cent drop from 97 to 78 new lifts, the total VTFH (Vertical Transport Feet per Hour) increased 14 per cent from 60,285 to 68,661. A higher VTFH is also an accurate measure of a higher investment figure.
(We strike another up-beat note by announcing that, after six years of explaining VTFH, we are no longer going to spell it all out, but will assume that everyone knows that it means the number of skiers who can be carried 1,000 feet vertically in an hour.)
The big trend, of course, is toward increasing capacity at the least possible cost. For more and more areas, this means re-engineering existing lifts, usually with some major modification to the drive train. These are listed in the tables and carry an “M” for Modification in the right-hand column. (Statistically, these are not counted as new lifts, but their new capacities—minus their old—are fed into our computerized ski life capacity calculations.)
Another important trend—again designed to maximize capacity at the least possible cost—involves the buying of existing lifts and relocating them. These are coded “R” for Relocation in our listing. No less than 17 lifts were relocated in the east and midwest this past year. It should be noted also that every relocation automatically involves modification—if only to achieve conformance with existing codes. (The rare “N” in the Code column refers to new areas.)

The new bullish regions are Canada, which shows very healthy growth, and the western U.S.. Almost 60 per cent of the new VTFH was accounted for by the U.S. West, and another 27 per cent by Canada.
We must also present disclaimers. We make this report as objective and informational as possible. But the modifications and relocations pose big problems. How, for instance, do you list a major modification on a Smith lift when it is engineered and executed by the Jones Lift Company? Rightly or wrongly, we decided that ‘Once a Smith Lift, always a Smith Lift,’ even though it may be as much a Jones lift as a Smith lift after the work is done.
Also, we want to note that, because of the long—and still increasing—lead time between sales contract and the finished new lift, our figures do not show sales, but installations. A lift company may have sold a dozen lifts in 1976, but they will show up in SAM’s annual recap only when the lifts are “on line” for skier use, and that could be next year or the year after.
Errors of fact and of judgment inevitably creep into a compilation such as this. We will, as always, attempt to correct these and keep the cumulative data as accurate as possible.
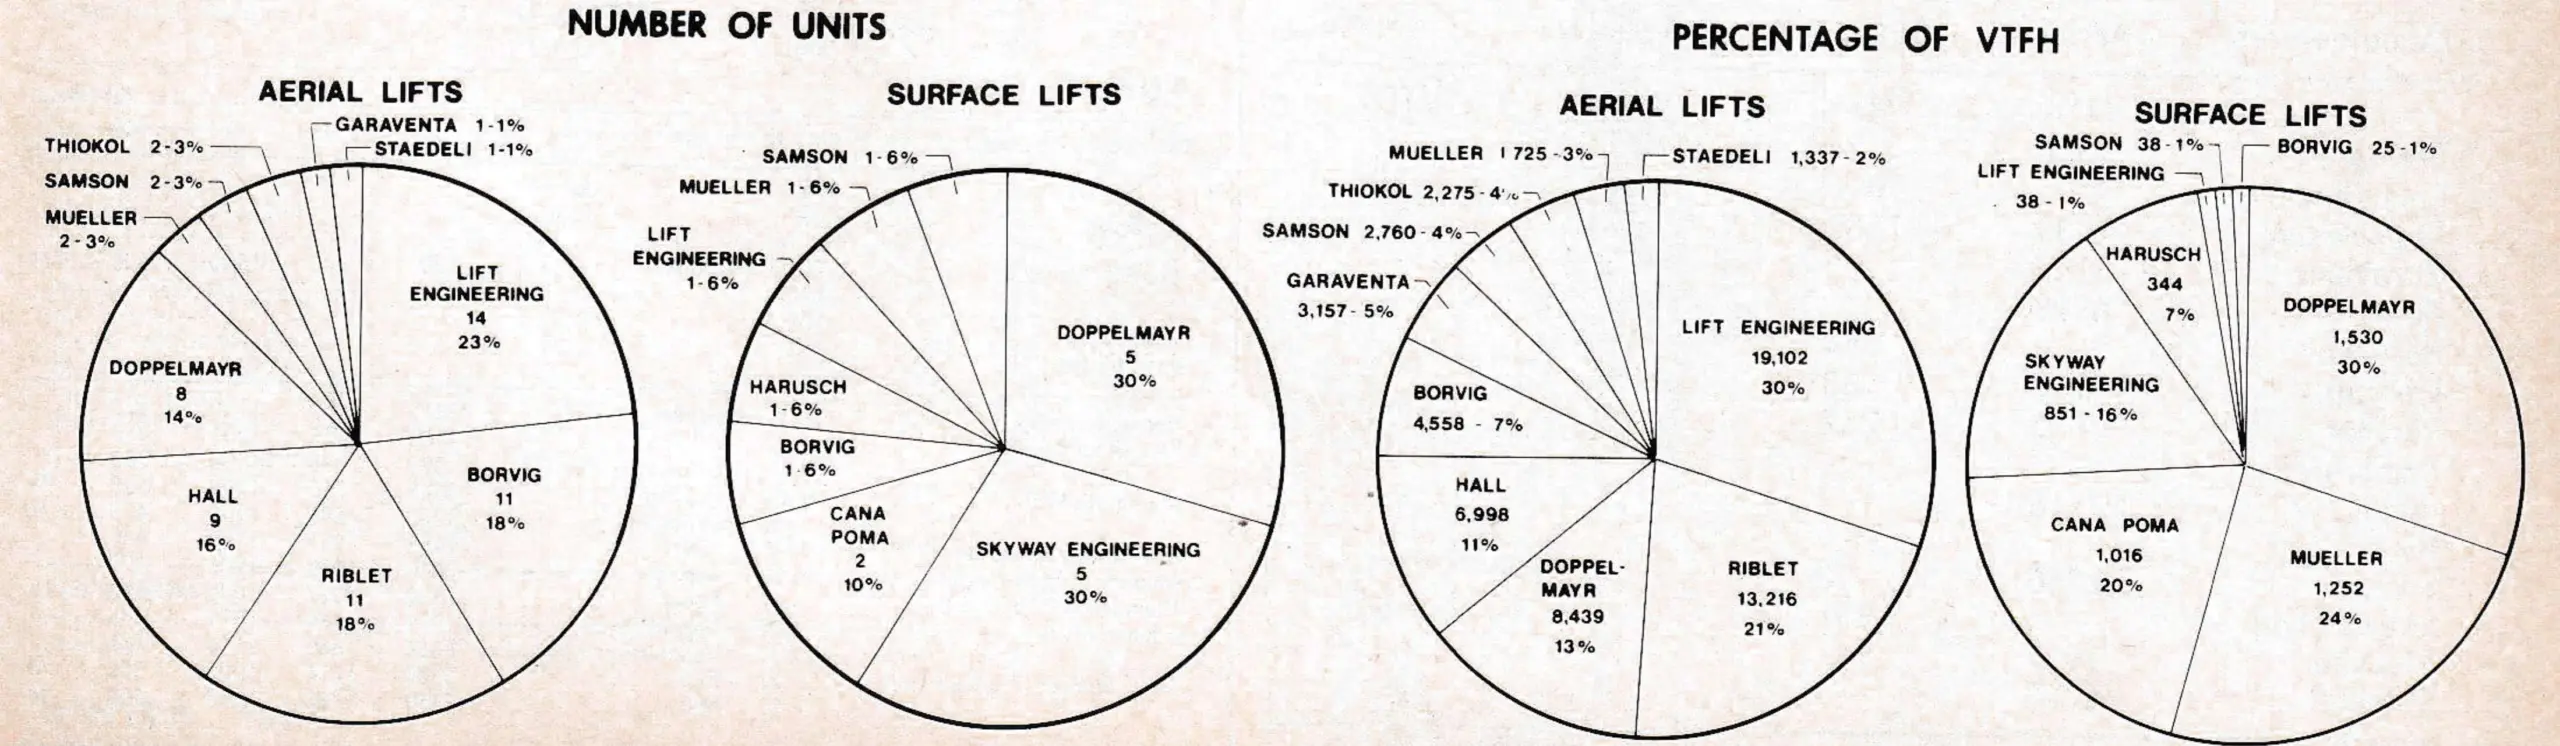
| Manufacturer | Units | Per cent |
|---|---|---|
| Lift Engineering | 14 | 23% |
| Borvig | 11 | 18% |
| Riblet | 11 | 18% |
| Hall | 9 | 16% |
| Doppelmayr | 8 | 14% |
| Mueller | 2 | 3% |
| Samson | 2 | 3% |
| Thiokol | 2 | 3% |
| Garaventa | 1 | 1% |
| Staedeli | 1 | 1% |
| Manufacturer | Units | Per cent |
|---|---|---|
| Doppelmayr | 5 | 30% |
| Skyway Engineering | 5 | 30% |
| Cana Poma | 2 | 10% |
| Borvig | 1 | 6% |
| Harusch | 1 | 6% |
| Lift Engineering | 1 | 6% |
| Mueller | 1 | 6% |
| Samson | 1 | 6% |
| Manufacturer | VTFH | Per cent |
|---|---|---|
| Lift Engineering | 19,102 | 30% |
| Riblet | 13,216 | 21% |
| Doppelmayr | 8,439 | 13% |
| Hall | 6,998 | 11% |
| Borvig | 4,558 | 7% |
| Garaventa | 3,157 | 5% |
| Samson | 2,760 | 4% |
| Thiokol | 2,275 | 4% |
| Mueller | 1,725 | 3% |
| Staedeli | 1,337 | 2% |
| Manufacturer | VTFH | Per cent |
|---|---|---|
| Doppelmayr | 1,530 | 30% |
| Mueller | 1,252 | 24% |
| Cana Poma | 1,016 | 20% |
| Skyway Engineering | 851 | 16% |
| Harusch | 344 | 7% |
| Samson | 38 | 1% |
| Lift Engineering | 38 | 1% |
| Borvig | 25 | 1% |