


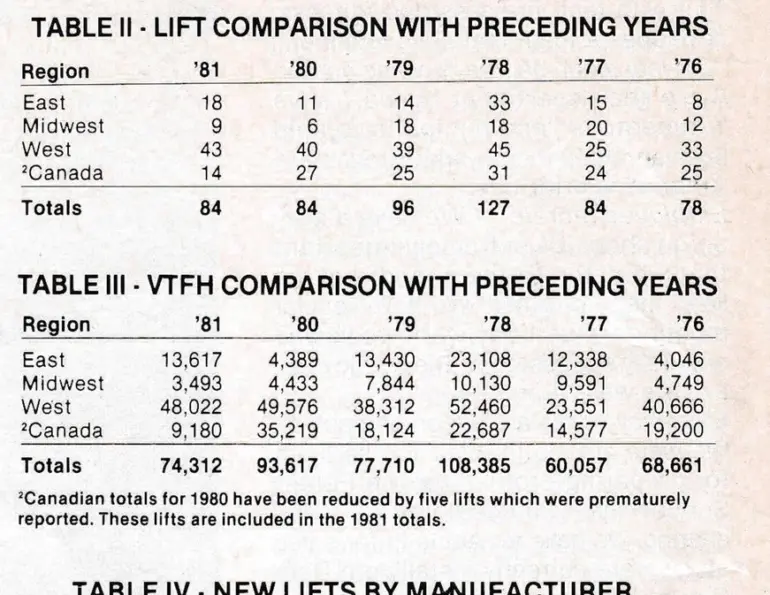
The grand totals for new lifts are even at 84, though the capacity added in terms of VTFH was down over 20% from 93,617 to 74,312. However, eliminating the Canadian figures, the number of new lift installations was up 23% in the U.S., and in terms of capacity, up 12% in VTFH.
VTFH stands for Vertical Transport Feet per Hour, and is the accepted measure of capacity, and at the same time this is a fair measure of investment. It is based on the vertical rise and the hourly lift capacity, and is expressed as the number of skiers who can be carried 1,000 feet vertically per hour.
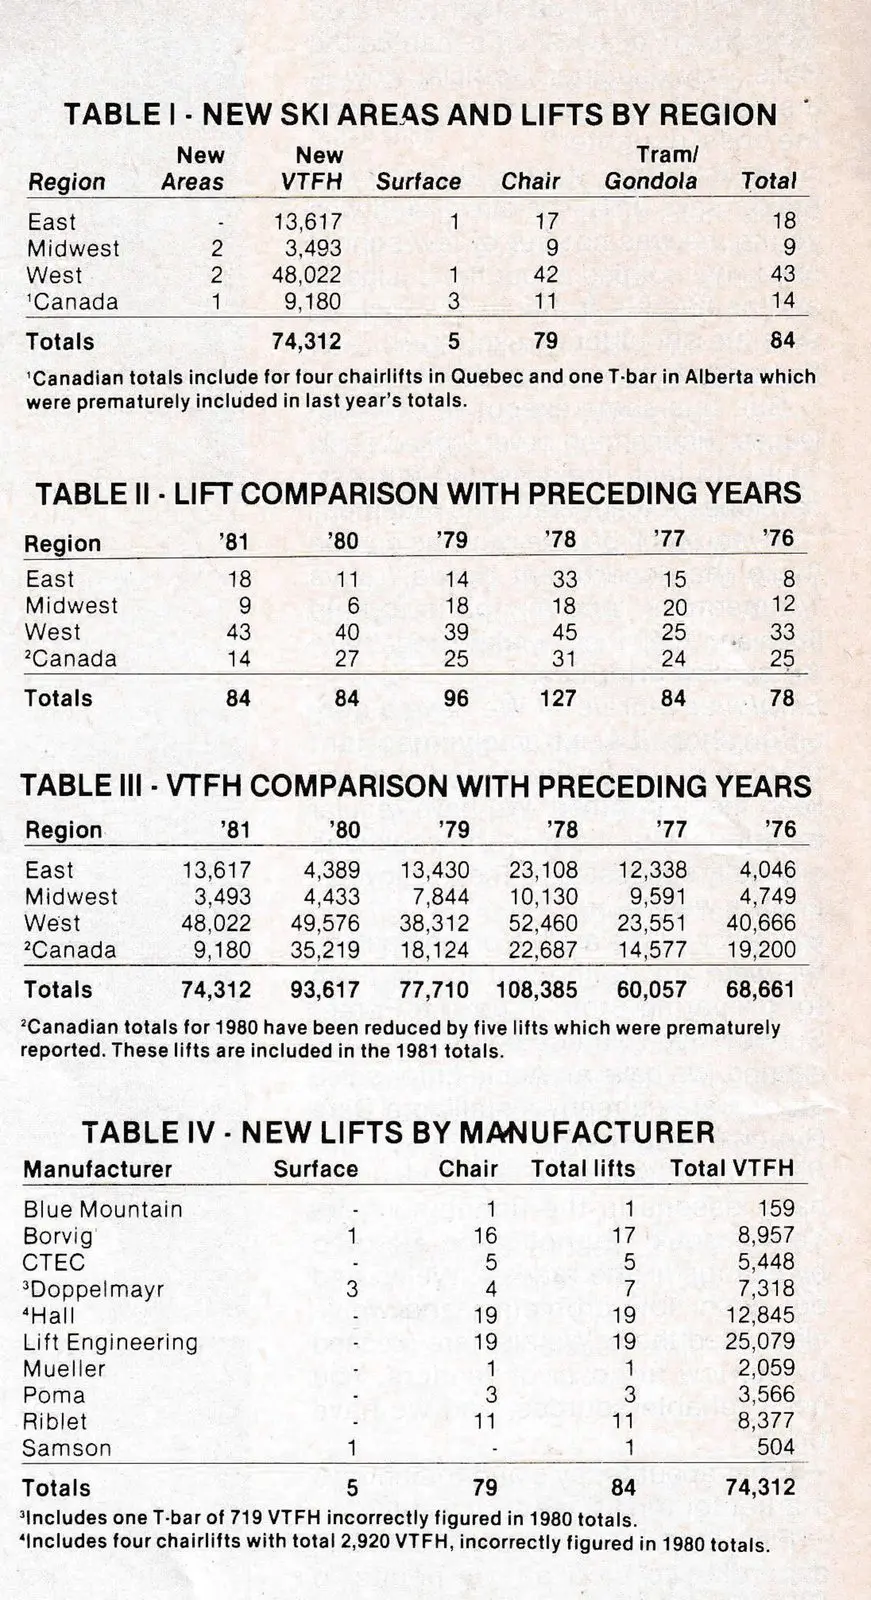
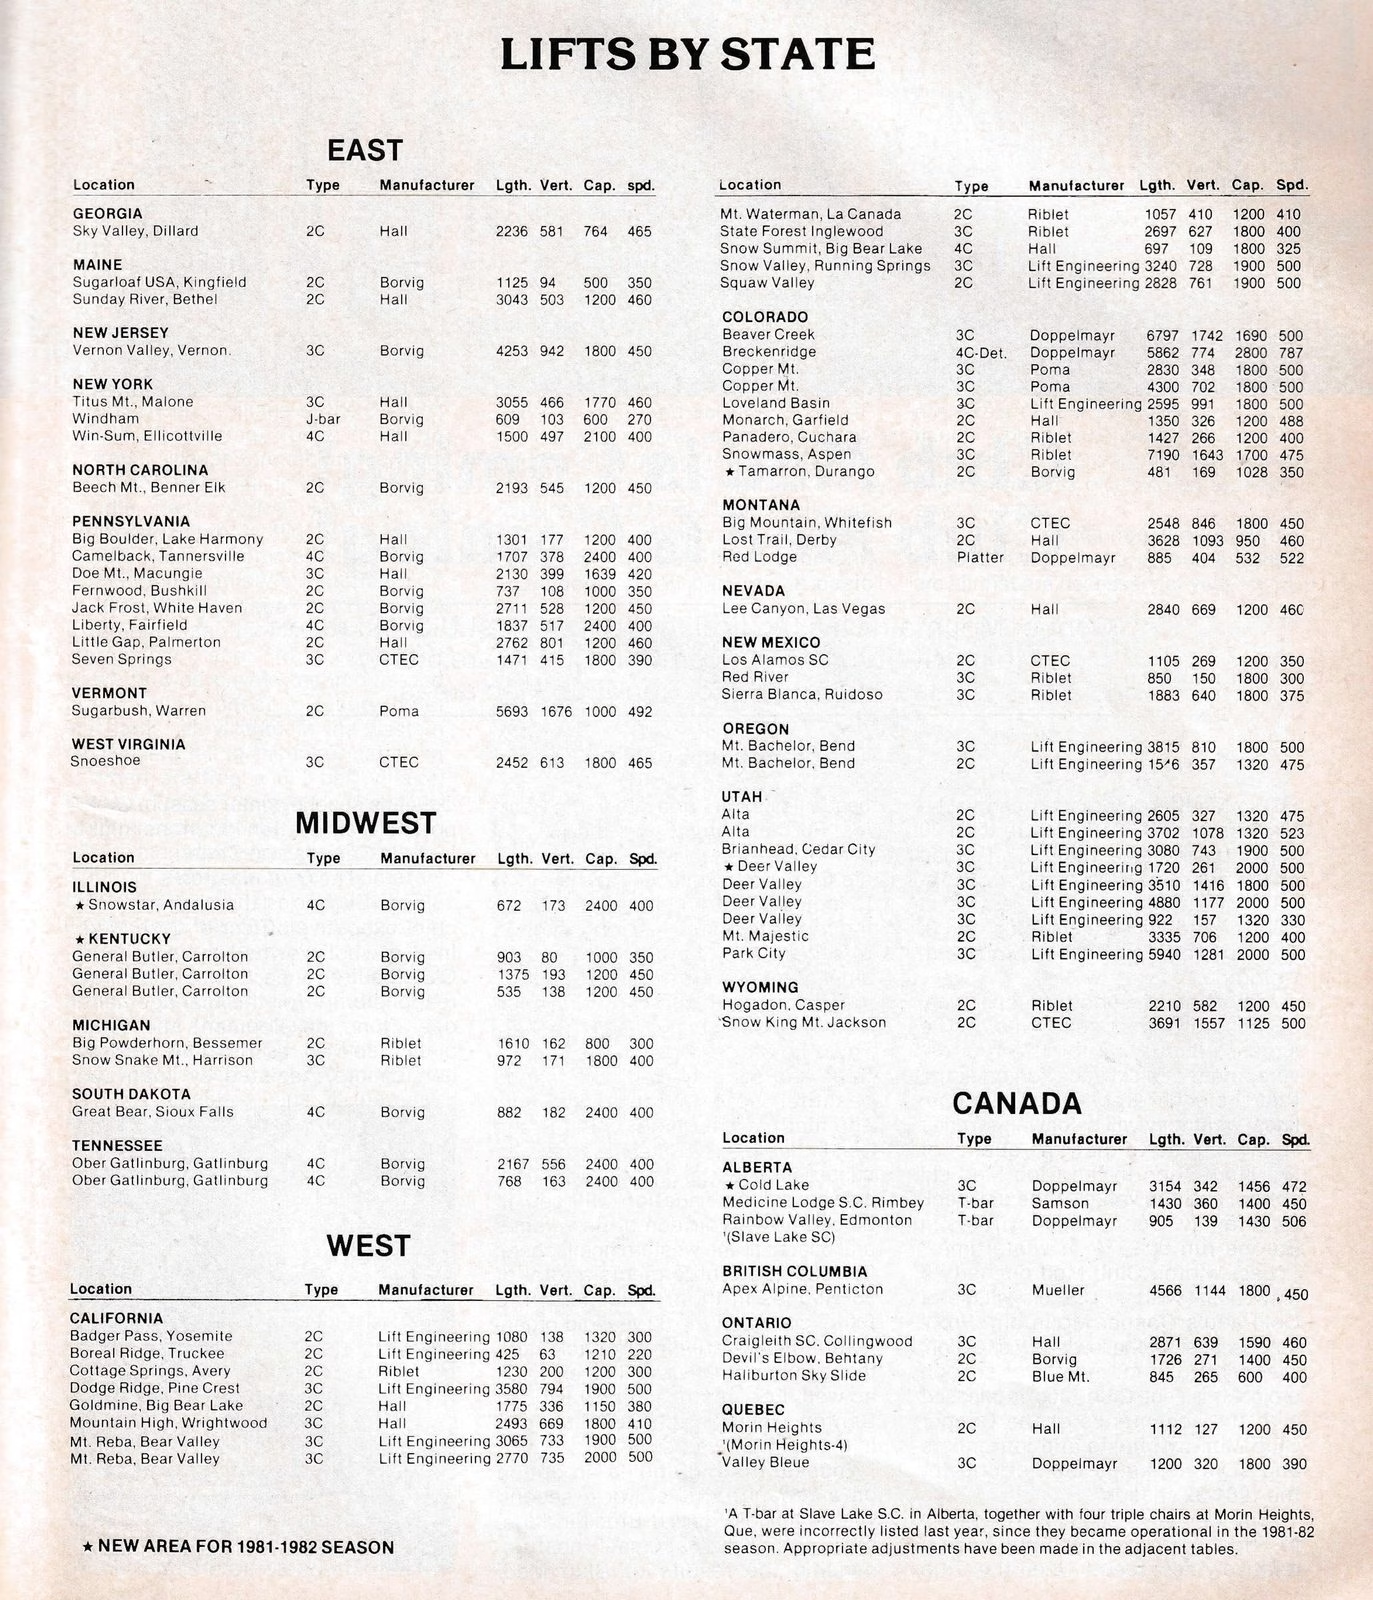
On the up side is the increase in the East of 64% in number of lifts, and exactly three times the VTFH. But, reflecting the character of last season’s weather, eight of the 18 lifts in the eastern total went up in Pennsylvania, representing 40% of the new VTFH for the whole East. For the second year in a row, Vermont got only one new lift. Massachusetts, Connecticut and New Hampshire got none.
The Midwest went up in lifts from six to nine, but three of these were at Kentucky’s brand new General Butler ski area—that state’s first—and two in Tennesee. The core of mid-American skiing country was barely involved with new lift construction: Michigan added two, but none went into Minnesota, and for the second year in a row, none into Wisconsin.
The West showed a picture very much like last’s year’s —up slightly in units, down fractionally in VTFH—but the names were different. As with last year, a major new resort put a skew into the statistics. Last year it was Beaver Creek coming on line which beefed up the Colorado totals; this year the five triple chairs at Utah’s giant new Deer Valley added over 8,000 in VTFH, or 17% of all the new western lifts. Three of those lifts are in the 2,000-plus category of VTFH. Utah, in fact, continues its boom—its ten lifts accounting for 17,754 new VTFH, or 39% of the western total. And this is on top of eight lifts and 12,341 VTFH in 1980. Perhaps the man was really right, and “This is the place.”
Colorado, on the heels of a ghastly snow year, still managed nine new lifts, with a total VTFH of 12,461. Included were three lifts in the over-2,000 VTFH category, and, of course, featured a lift commanding considerable attention in the industry: the Doppelmayr detachable quad at Breckenridge.
The biggest swing in North America occurred in Canada, which dropped dramatically. Last year’s figures in SAM were overstated for Canada because four chairs in Quebec and one T-bar in Alberta were prematurely listed as operational for 1980-81, instead of for the current 1981-82 season. To give readers the clearest possible picture we have corrected the 1980 figures in this year’s tables by removing those five lifts from 1980 totals and adding them into the 1981 totals.
Even after these adjustments, the new lifts dropped from 27 to 14, while VTFH plummeted almost 400% from 35,219 to 9,180. Last year, the five lifts at the new Blackcomb development in British Columbia, plus the three at neighboring Whistler, accounted for 14,900 in VTFH. B.C. added 26,223 in new VTFH in 1980, but only 2,059 in 1981.
Of course, in this index we measure and record only new lifts. We do not include VTFH that is added through re-engineering, extension and other modifications. Nor do we include relocations. The other side of this coin is that neither do we attempt to report on lifts which for one reason or another become inactive, and therefore not a part of the total inventory of North American capacity.
It is almost impossible to measure all this activity, let alone name it. For instance, a double chair at Killington was modified, adding one-third to its capacity. The existing Killington double chair’s fixed drive manufactured by Hall was relocated to the Ramshead Poma chair and installed on a CTEC terminal structure. CTEC’s Jan Leonard suggests a “Po-Hal-Tec” label for this hybrid.
Lift Engineering also did major modifications at Killington, as well as at Mt. Snow and Mammoth; Mueller re-built two T-bars in B.C.; Poma engineered a major modification on Hunter Mountain’s “D” triple; and Borvig almost tripled the size of a double chair at Attitash, N.H., and also extended a double at Maine’s Sugarloaf. These last two modifications added almost 500 in VTFH, yet, as a matter of consistency, we do not include them in our new lift index.
Knapp Associates, brokers of used ski area equipment, reported “normal” activity in resale of lifts. Hugh Knapp explained that there is normally a greater demand than there is supply, and that this had been especially true of chairlifts, with new areas aggressively seeking used lifts.

In passing, we note that there are five areas reported as new in the listing: Tamarron in Colorado, Deer Valley in Utah, General Butler in Kentucky, Snowstar in Illinois and Cold Lake in Alberta. However, there are other newborns, but they don’t make this list because they start with either a used and relocated lift, or perhaps with a rope tow or wire rope—just as the golden oldies once did.
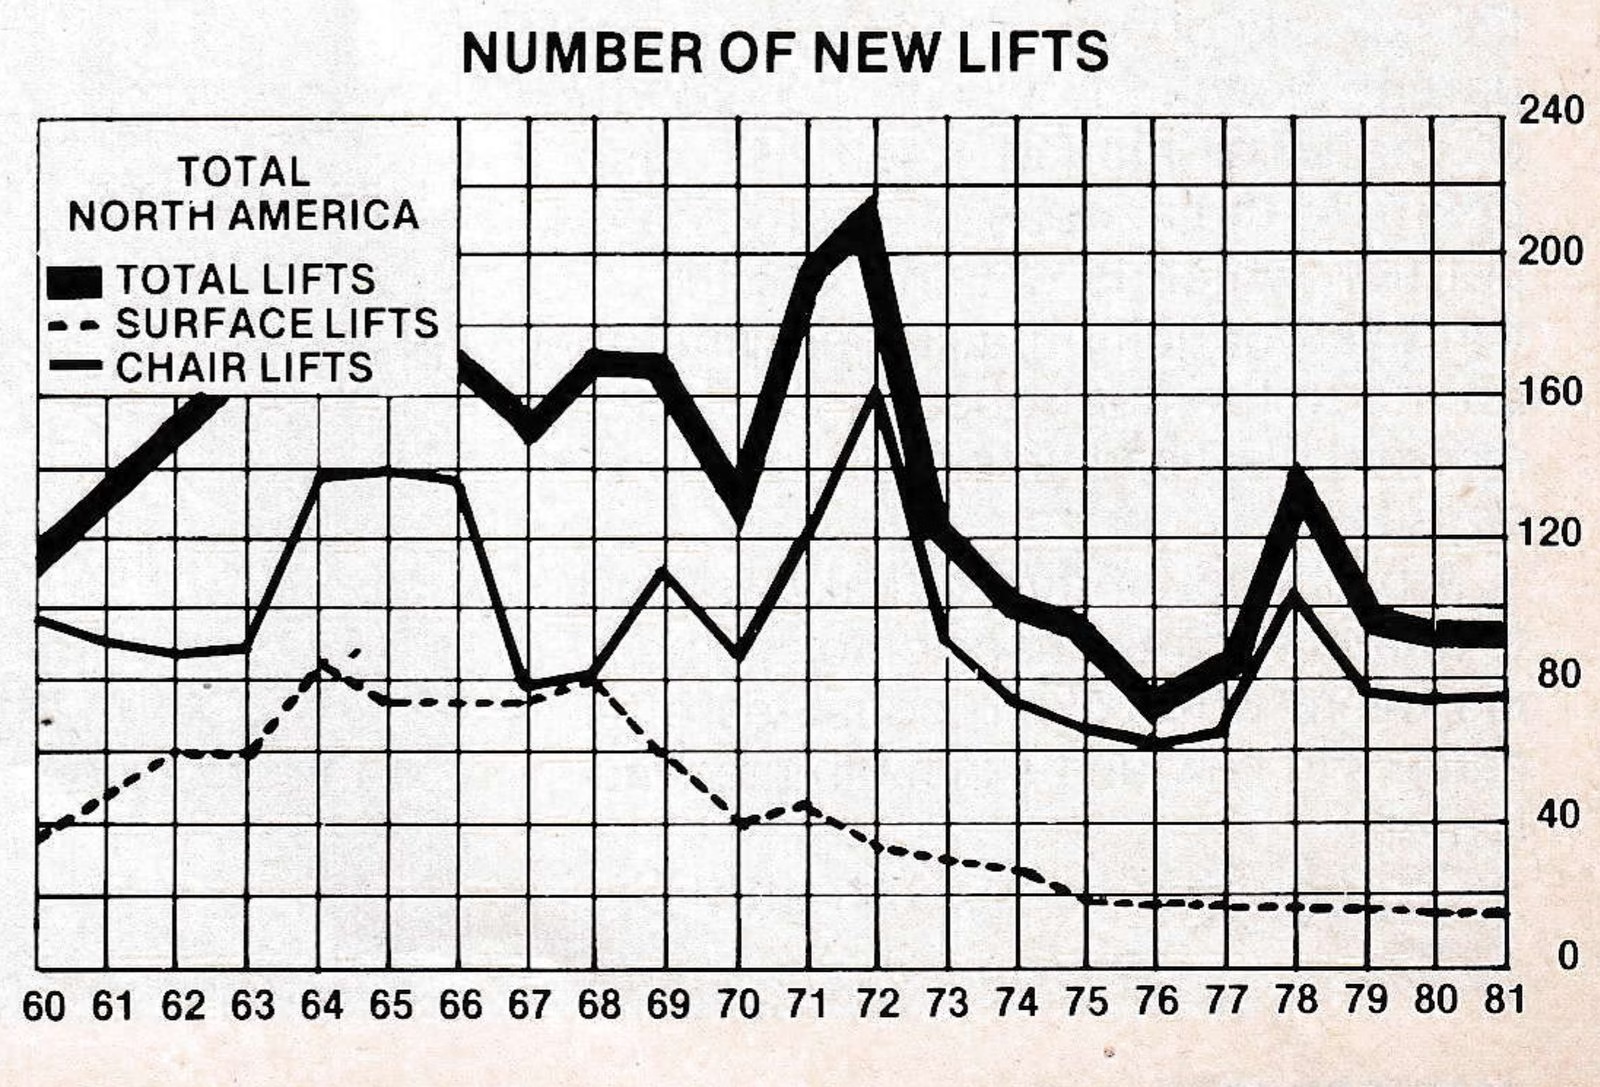
Going back to the new lifts, this was another good year for multi-seat configurations. Triples and quads together accounted for 57% of all chairs installed—about the same as last year—while quads alone increased from five to nine.
The very big lifts—those in the 2,000-plus category of VTFH—were down to eight from last year’s high of 14, and unlike last year, none was in the over-3,000 category. But this should be viewed in the perspective that there were only six in the over-2,000 range in each of 1978 and 1979.
It was another strong year for wire rope tops, which we do not tally statistically. O’Connor Ski Lifts, for instance, put in no less than 13 Stadeli Pony’s, five of them at River-
view Highlands Ski Area in Riverview, MI. Others went in from North Carolina to Colorado to California. These lifts added an impressive 882 to the national VTFH. Meuller sold two Borer handletows in western Canada, and Harusch of Canada also had a good year with theirs.
Another category not recorded statistically here are foreign and non-ski lifts installed by North American-based companies. Lift Engineering continued its good penetration of the French market by putting in three triples, two at Val d’Isere and one at Tignes. The New Jersey-based Montaz-Mautino installed two lifts in Acapulco—one a double chair, and the other a “pulsating-type” gondola—a system developed in Europe for transporting skiers from the village, condominiums or parking areas to the ski lifts, in groups of fixed-grip cabins.
Given the nature of the interest rates in 1981—to say nothing of the natural snowfall recorded last season—the investment in new lift construction in 1981 was more than many figured it would be, and was indicative of the underlying stability of the resort end of the ski industry.
As for the future, it is hard to spot significant trends when the variables are, well, so variable. What will be the impact of recession (how deep, how long) and continued high interest rates on skier growth, and thus on pressure for new uphill capacity? Will changing policies on land use mean more new ski area starts?
Lift manufacturers would love to know some of these answers. But they can also derive some comfort in the knowledge that this year’s totals, when viewed in a 5-year context, look very much like the market bottom occasioned by years of snow, energy and fiscal constraints. With half a break, the chart could surge upwards. For the time being, capacity is the name of the game—more bang for the buck. And more than ever in the past, demand in terms of skier pressure, will be the determinant.