


Each decision is difficult because little useful information is available to help in the decision-making process. Furthermore, the two decisions are interdependent, making them even more complex.
A few years ago at Deer Valley, we became aware that the process for making these decisions was, at best, an inexact science. Our response was to investigate avenues for collecting pertinent data and translating it to useful information.
Deer Valley already had accumulated the typical demographic data which most ski resorts use. We knew age, sex, skiing ability, occupation, favorite magazine, home city, size of family, number of days skied each year, etc., of the Deer Valley guest. In addition to the demographic data we had encouraged our guests to comment on our product. The majority of positive comments related to psychological/behavioral variables such as comfort, predictability, excitement, being hassle-free, ambiance and tranquility.
What we didn’t know were which components of our product (i.e., short lift lines, professional staff, attractive lodges, etc.) created positive reactions towards these psychological/behavioral variables. We believed that systematic data collection and analysis could help discover the answers. Most important, those answers might help us make decisions about what to change and where to spend money.
We hired a professional surveying organization to ask our target market to describe which components of our product created psychological/behavioral variables. The research identified and put a value on 10 significant components:
- Quality of personal service
- Ambiance of day lodges
- Quality of food and beverage operations
- Quality and number of ski trails
- Quality of child care services
- Quality and extensiveness of trail grooming
- Ability to store skis and ski boots overnight
- Length of lift lines
- Length of cafeteria lines
- Ski Patrol presence
In essence the guests were asked where their price resistance was, i.e., how much more they would spend relative to improvements in various components. From this data we were able to develop a method of measuring the impact of each component on the current price of the lift ticket. For example, which is more important, a professional staff or a shorter lift line and how much would guests pay for improvements in these components?
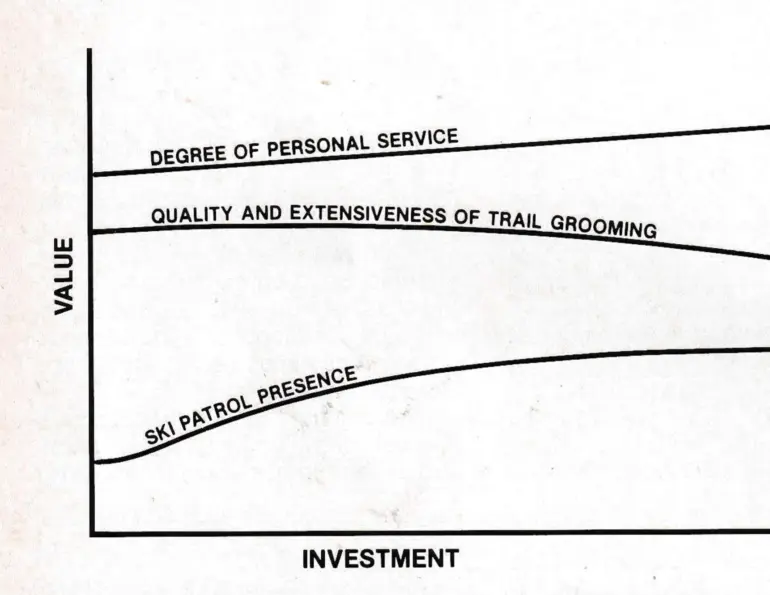
We graphed each value component in order to describe the relationship between increased investment and the cost of lift ticket. (Three value component graphs are illustrated.)
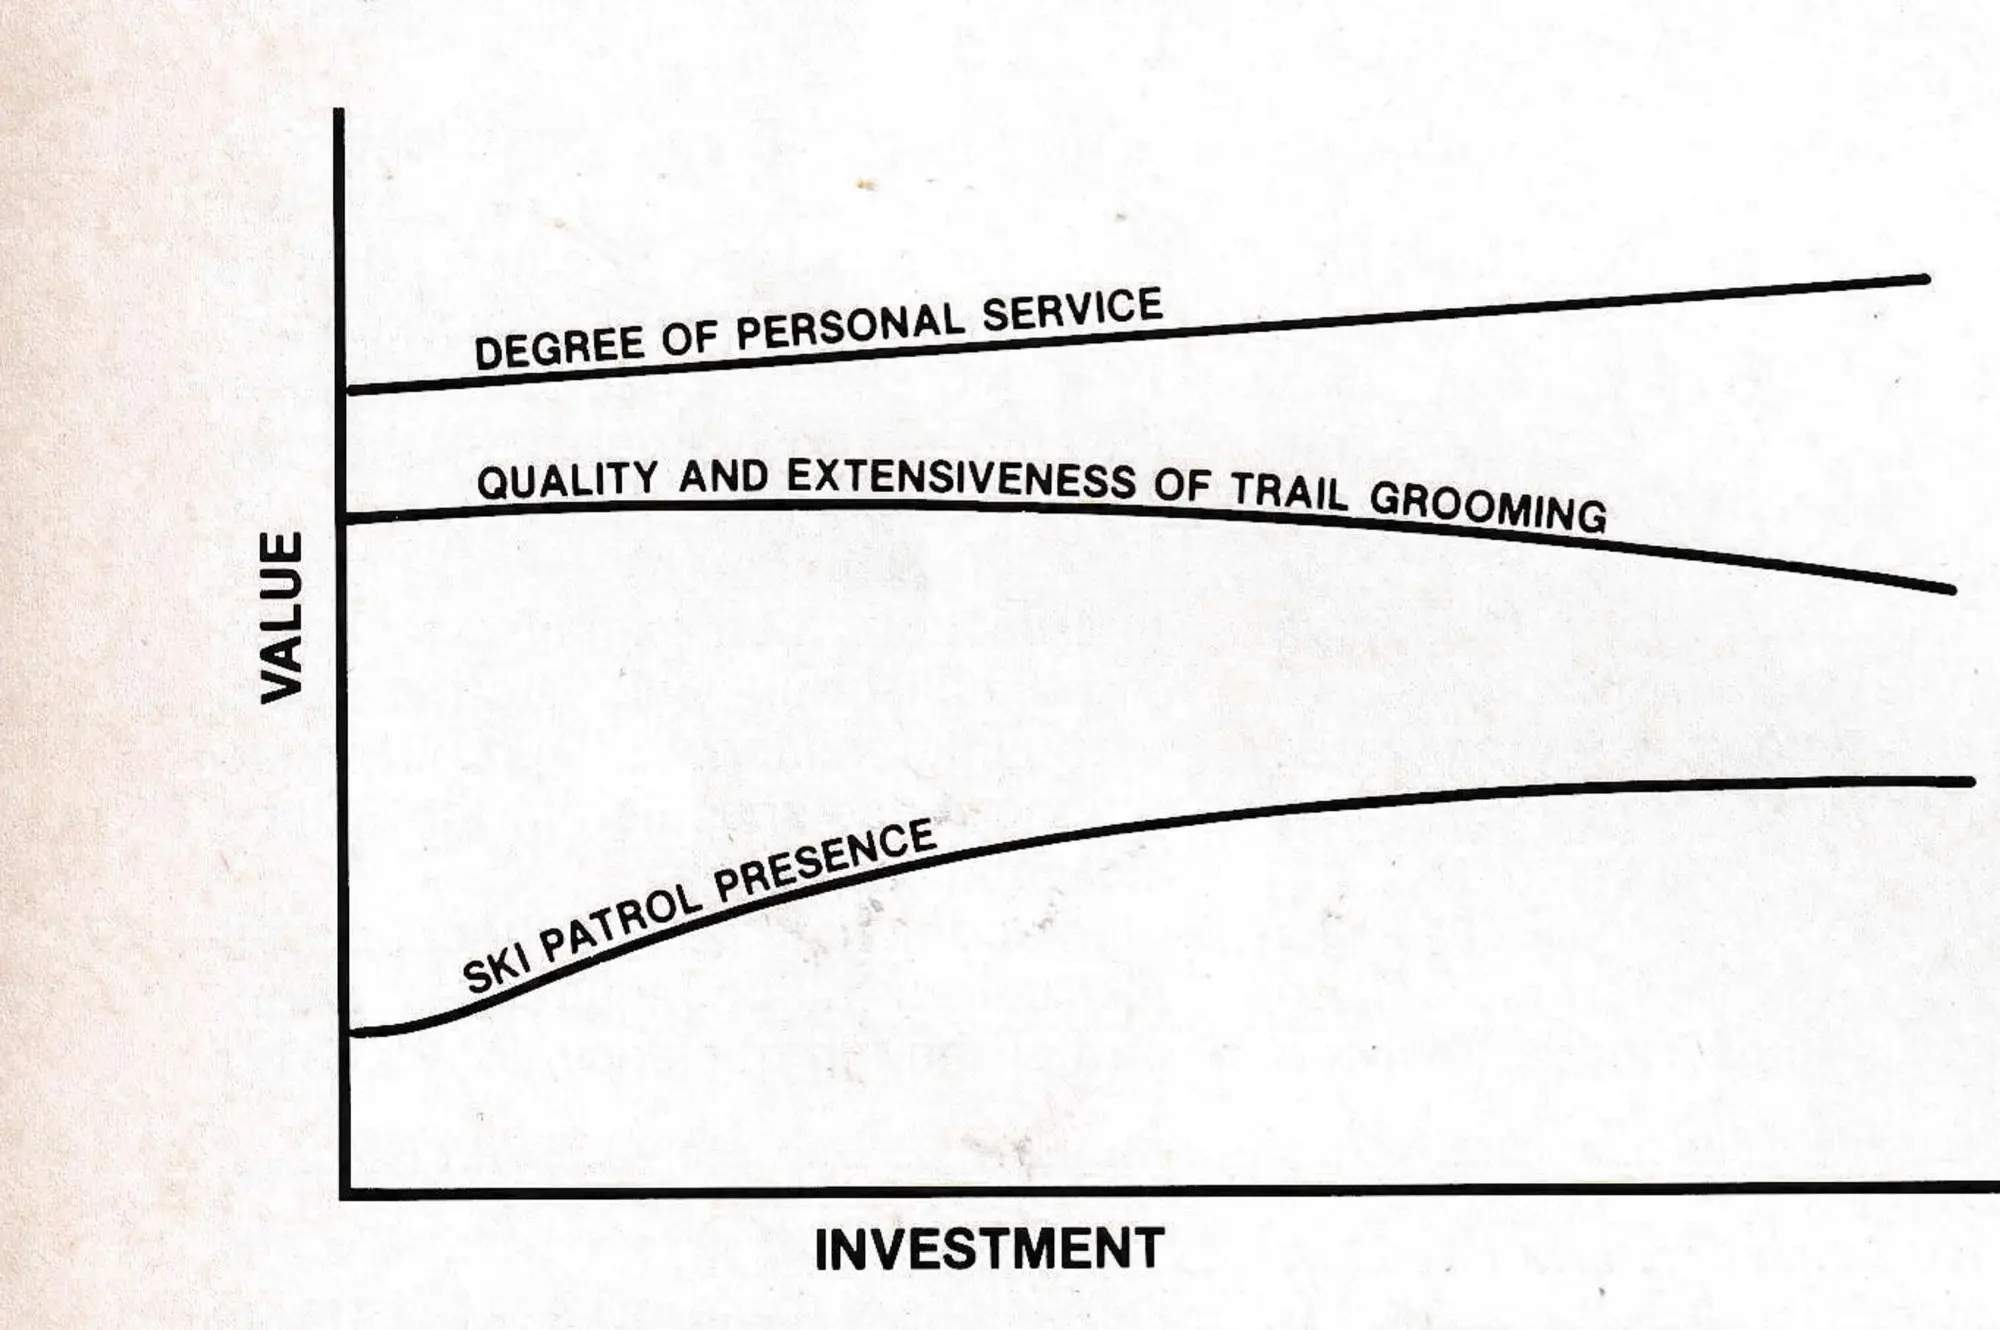
The vertical axis describes the “value” that individual components add to the current lift ticket price. Value increases as there is upward movement along that axis. The horizontal axis represents investment dollars. Movement to the right along this axis occurs when investment is made in a value component.
The accompanying graph indicates that “Degree of personal service” contributes significantly to the current value of the lift ticket (its starting point is high on the vertical axis). Increased investment in this component will bring about a small increase in lift ticket value (as shown on the horizontal axis).
“Quality and extensiveness of trail grooming” also contributes significantly to the current value of the lift ticket. Increased investment in this component, however, will not increase lift ticket value. In fact, increased investment at some point will bring about a decrease in value as illustrated by the downward sloped curve.
“Ski Patrol presence” does not make as significant a contribution to current value as the other components. However, increased investment in this component leads to a significant increase in value as illustrated by the upward sloped curve.

Such graphs would seem to provide answers to basic questions such as: With funds available for capital improvements, should I upgrade personal service? Should I do more grooming? Should I hire more ski patrollers?
At Deer Valley the effect of the value components illustrated in the graph was to increase the number of employees in customer service, level off grooming at the present amount and change the ski patrol work patterns to make them more visible when customers are on the mountain.
When the survey is done annually we have discovered that new information and changes in the business climate necessitate further changes in components. The decisions made one year are not molded in concrete to remain forever.
It should also be kept in mind that each ski area has individualized value components which reflect target market needs, operational philosophies and organizational objectives. What is a good investment for one ski area may or may not be a good investment for another.
Using this technique, however, an area manager may discover that $100,000 invested in a customer service component such as overnight ski storage will create more lift ticket value than the addition of a one million dollar chairlift.
Value component curves can provide useful information when deciding upon next year’s lift ticket price. The amount of upward movement along the vertical axis tells how much value has been added to the product. We can adjust lift ticket prices, relative to that increased value without alienating our target market.
This research provided decision making assistance in other aspects of area management. Our marketing department more accurately portrays images in ads that are of significant value to our target market. Our sales department has a better understanding of which components of our product are most saleable. Our operations managers have a better idea where to allocate human resources to maintain and create value. Our real estate department better understands the notion that the more value added to our lift ticket, the more value and saleability is added to our real estate.
Certainly this kind of customer information cannot replace business intuition or experience. It is however, a valuable tool to enhance the decision-making process on two of the area manager’s most perplexing problems; pricing and investment.