

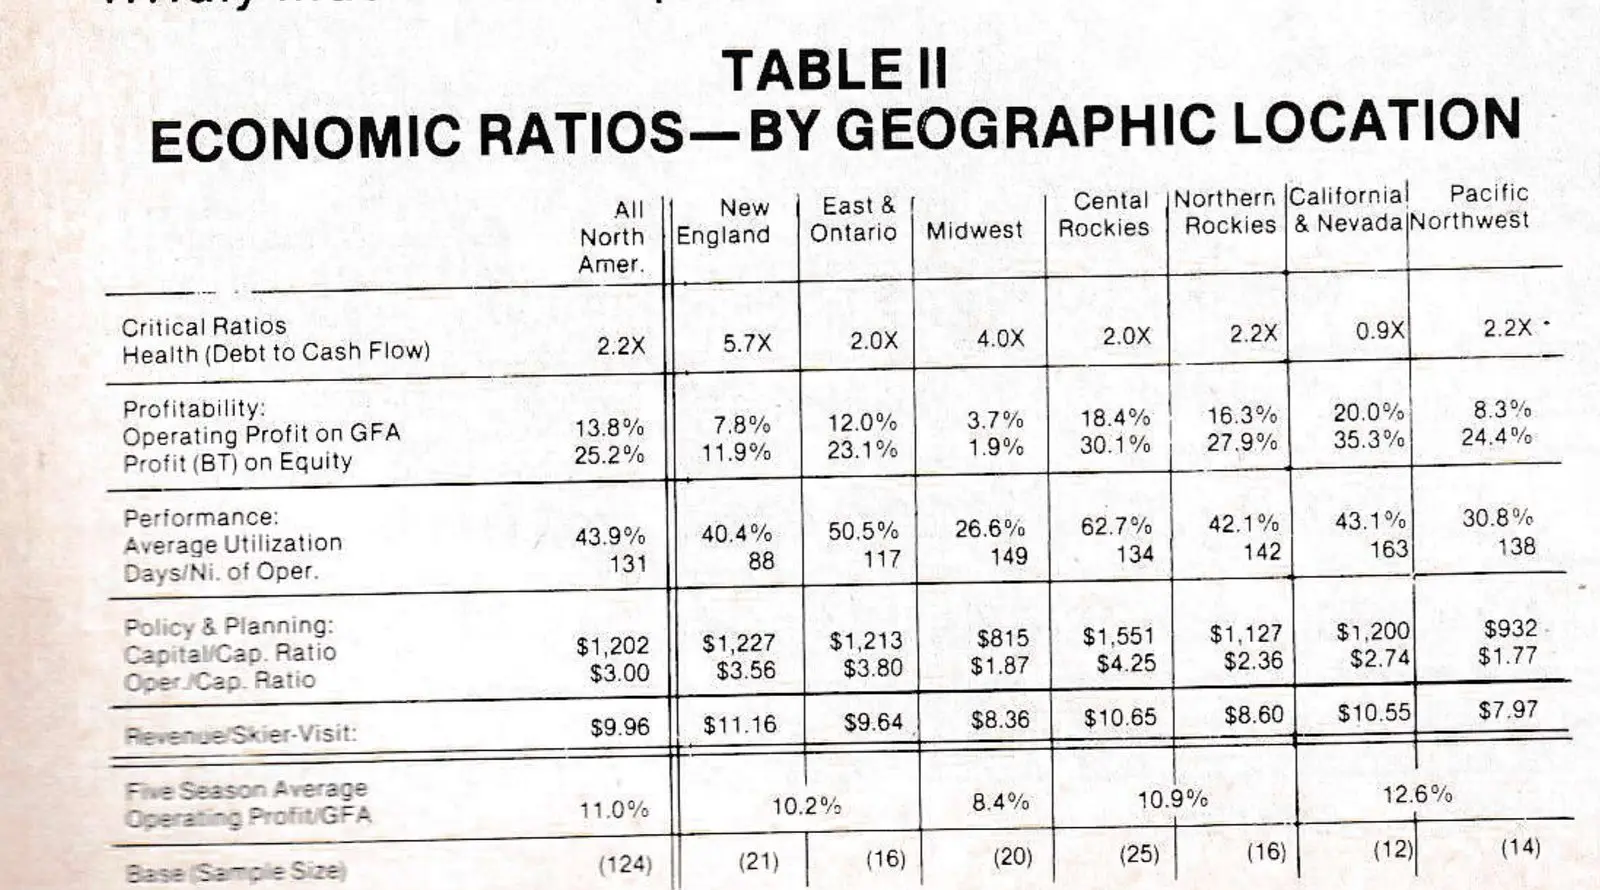
The 1978-79 ski season recorded mixed results. Again weather conditions were adverse in the East, Mid-west and Pacific Northwest and resulted in a significant drop in operating results. The Rockies and California/Nevada regions had good seasons and helped keep average results acceptable. Operating profits amounted to 13.8% of Gross Fixed Assets, (GFA) down slightly from the record 16.2% of 1977-78. These results were accomplished with an average utilization of 43.9% of capacity, essentially the same rate as 1977-78. The most profitable ski area recorded a phenominal 48.8% operating profit on Gross Fixed Assets, and 22 ski areas reported 20.0% or higher.
At the same time only 93 ski areas report making a profit (82%), down considerably from 93% last season. Table 1 summarizes these measures and compares the 1978-79 season to past years.
| 1978-79 | 1977-78 | 1976-77 | 1975-76 | 1974-75 | |
|---|---|---|---|---|---|
| Operating Profit on G.F.A. | 13.8% | 16.2% | 1.6% | 10.5% | 11.3% |
| Profit After Tax | 12.6% | 16.0% | LOSS | 10.5% | 11.4% |
| Proportion of Ski Areas Reporting a profit | 82% | 93% | 52% | 84% | 73% |
| Five Year Average Operation Profit on Gross Fixed Assets | 11.0% | 9.6% | 7.3% | 9.4% | 8.9% |
The bottom measure is my attempt to level out the effect of varying winter weather by constructing a five year average. These figures are all based on the average of the five previous seasons, thus including both good and bad weather seasons. It is encouraging to note the apparent slight improvement in this critical measure, except, of course, after the disastrous 1976-77 season, in the west.
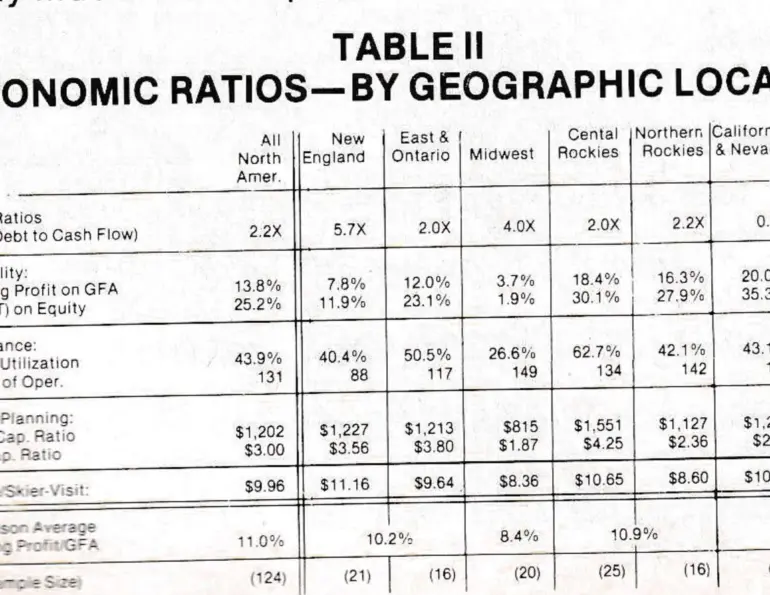
Table II again summarizes the eight critical variables by geographic region and illustrates some significant regional variations. The critical effect of weather can be seen in the New England, East and Ontario regions where average days/nights of operation at 88 and 117 respectively were down some 30% from the 1977-78 season.
One other critical factor contributing to a lower profitability is the existence of a cost-price squeeze. Table III vividly illustrates the problem.
| 1977-78 | 1978-79 | Change | |
|---|---|---|---|
| A) Average Skier-visits | 178,000 | 181,000 | + 1.7% |
| B) Average Gross Revenue | $1,741,000 | $1,953,000 | +12.2% |
| C) Average Expenses | 1,352,000 | 1,575,000 | +16.5% |
| D) Average Profit | $ 389,000 | $ 378,000 | -2.8% |
In spite of a 1.7% growth in skier-visits and a 12.2% growth in revenues, a 16.5% growth in expenses resulted in a decline in profits.
Again however, while average profitability dropped below levels judged adequate to compensate for the risks, the Rockies and California/Nevada regions illustrated profit levels above that required to attract capital. While the question of what is an “adequate” return in relation to the risks remains a function of individual investor goals, I believe a 18.7% operating profit on gross fixed assets is generally an attractive return. This equates to a 20% after-tax return on equity.

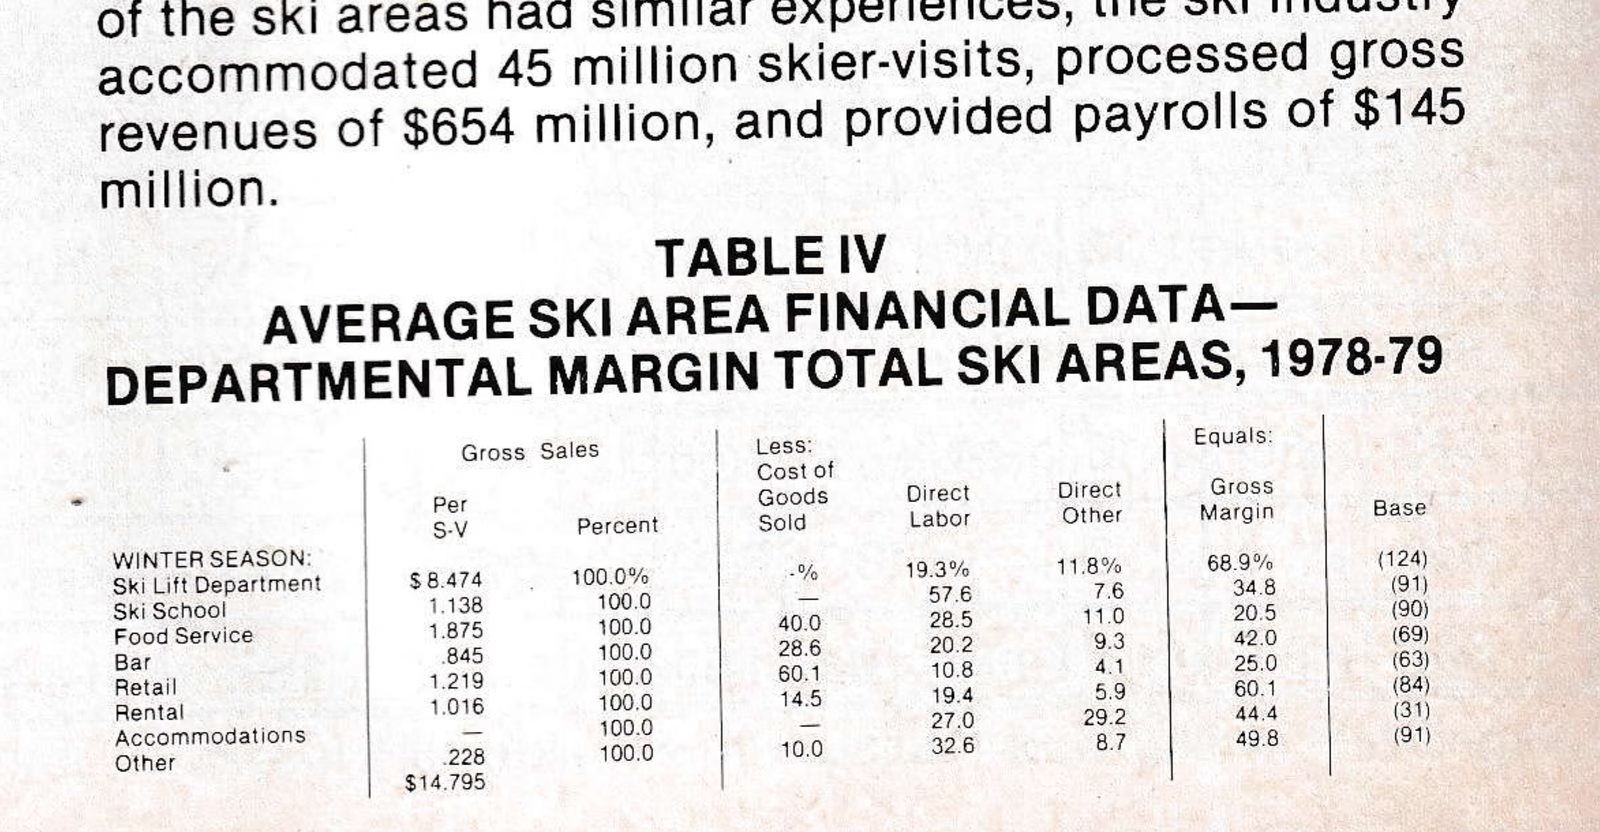
Table IV summarizes average departmental revenue per skier-visit, costs and margins. This is the second report to incluse this critical break-down. This table includes only those operations that run these departments and excludes concessionaires. Thus the average skier spends $14.80 per visit for all of the goods and services purchased.
As with the 1977-78 season, these results should encourage new investment. Demand continues to grow, average profitability as measured over a five year span is climbing, and well conceived, well-managed ski areas are earning returns commensurate with the risks.
The top half of the profitable ski areas enjoyed a 20% increase in average profits in spite of a 39% increase in operating costs. Their average operating profit on GFA equaled 21.2%, or above my 18.7% goal. This excellent performance was due to a combination of (1) a longer season; (2) higher revenue per skier-visit; and (3) greater utilization.
The 1978-79 study is the eleventh annual economic survey of North American Ski Areas and the sixth one produced by the Business Research Division of the University of Colorado. The study is under the auspices of the Economic Study Committee of the National Ski Areas Association. The report format remains essentially identical to previous studies to increase comparability and standardize measurements. The report contains ten chapters and 89 tables of data.
The data represent ski areas possessing approximately 50% of the ski area capacity of the nation. If the balance of the ski areas had similar experiences, the ski industry accommodated 45 million skier-visits, processed gross revenues of $654 million, and provided payrolls of $145 million.