


It will come as no surprise to see that the figures indicate the 1980/81 snowless year was second only to the infamous 1976/77 season in poor returns. While the average ski area reporting recorded an after tax profit of $112,000, this was due primarily to a large real estate margin. The winter season actually showed an $86,000 loss.
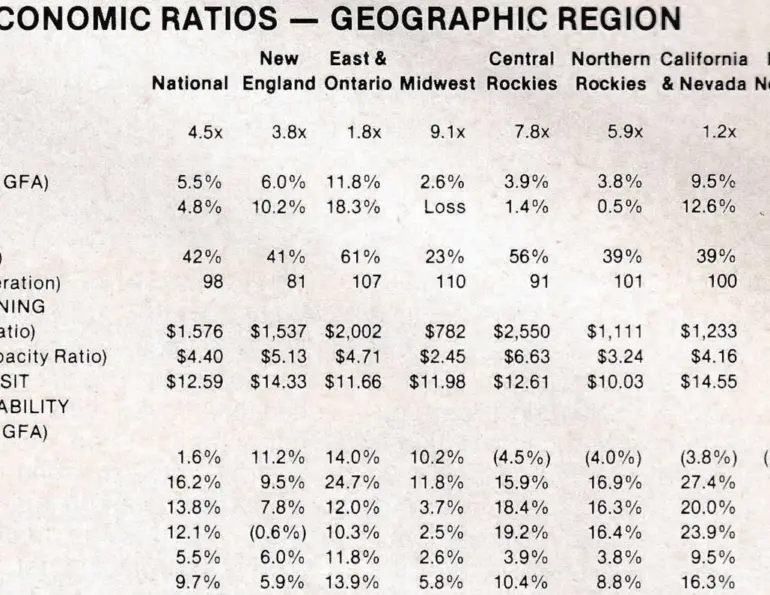
Table 1 is a summary of the eight critical variables by geographic region. It is hard to make any statistical observations after a low snow winter, as the quality of the product has more to do with results than the statistics. However, the brightest picture comes from the Eastern and Ontario areas which are heavily dependent on snowmaking and serve high population concentrations. Their 11.8% operating profit on GFA came from a combination of a 61% utilizaton, an adequate average revenue per skier-visit, a slightly above-average operating cost capacity ratio and an above-average period of operation. As a result, they illustrate the second highest five-year average operating profit on gross fixed assets. The California/Nevada area is the most profitable. These two regions, consisting mainly of the populace states of New York and California, both enjoy relatively long operating seasons but with different characteristics. The New York, Pennsylvania and Ontario areas have night skiing, whereas the Sierras enjoy a relatively long natural season.
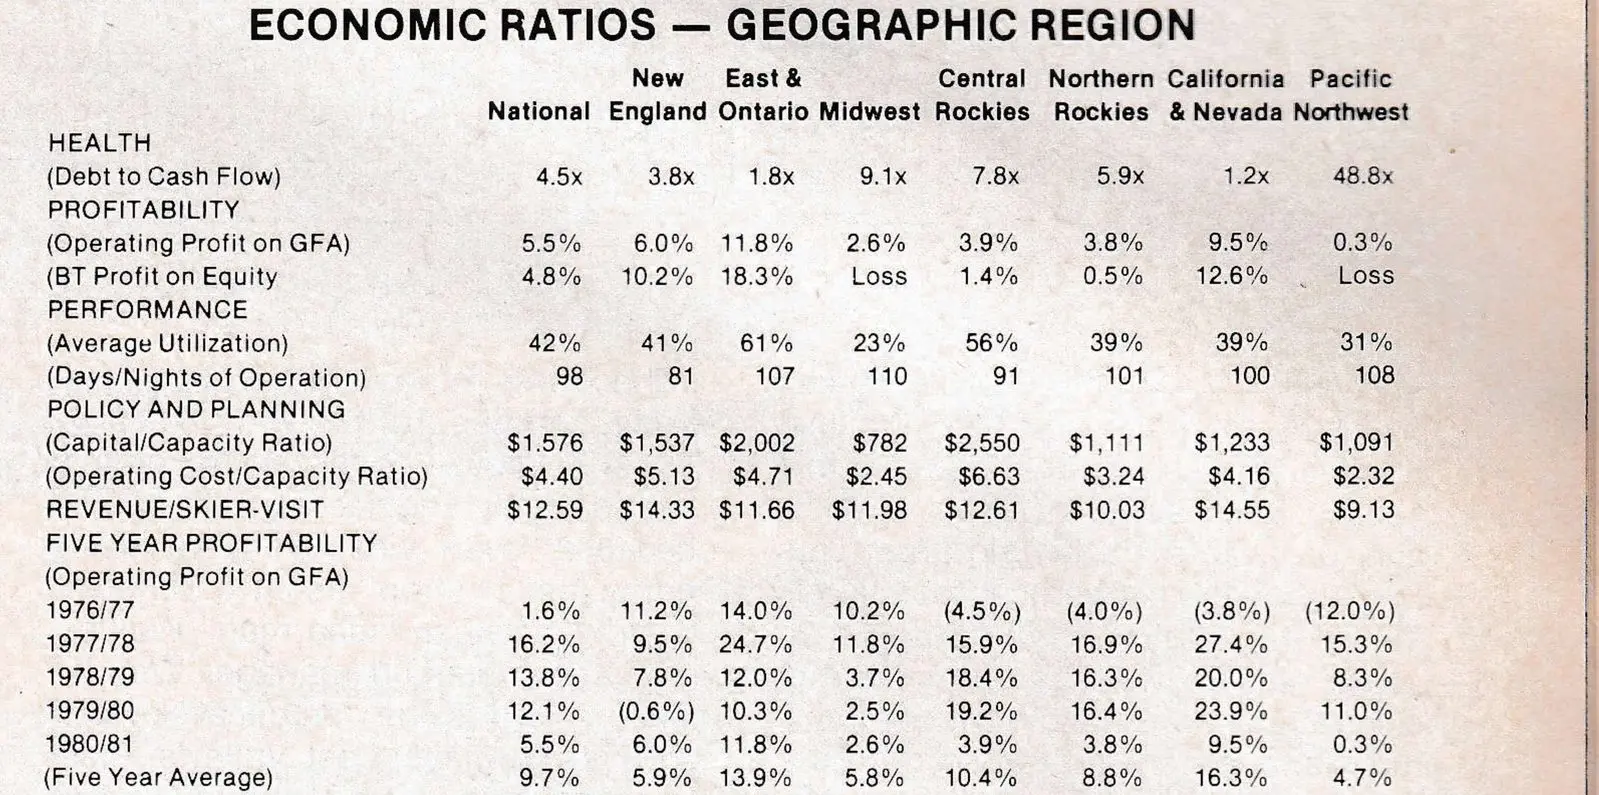
Again, in general, the snowmaking installations proved their worth. With two meteorologically disastrous winters in the last five, the industry would be bankrupt without snowmaking. National averages, of course, can be very misleading. Table 1 also summarizes operating profit on gross fixed assets for the past five seasons, with a five year average. Eastern areas were strong in 1976/77, down in 1979/80, and rebounded a little bit last year; while the larger Western areas skew the national results when their weather is bad.
The geographic breakdown highlights the very different regional strategies. The New England ski areas, with an above-average operating cost per capacity ratio, achieve their performance by attracting higher utilization at higher revenues. The Midwestern areas, with average revenues and below average costs, fail to record acceptable results as utilization is the worst of all regions. The Pacific Northwest region, with the lowest operation cost per capacity ratio, achieves a reasonable utilization rate, but at a too low revenue per skier-visit, thus failing to generate adequate returns.
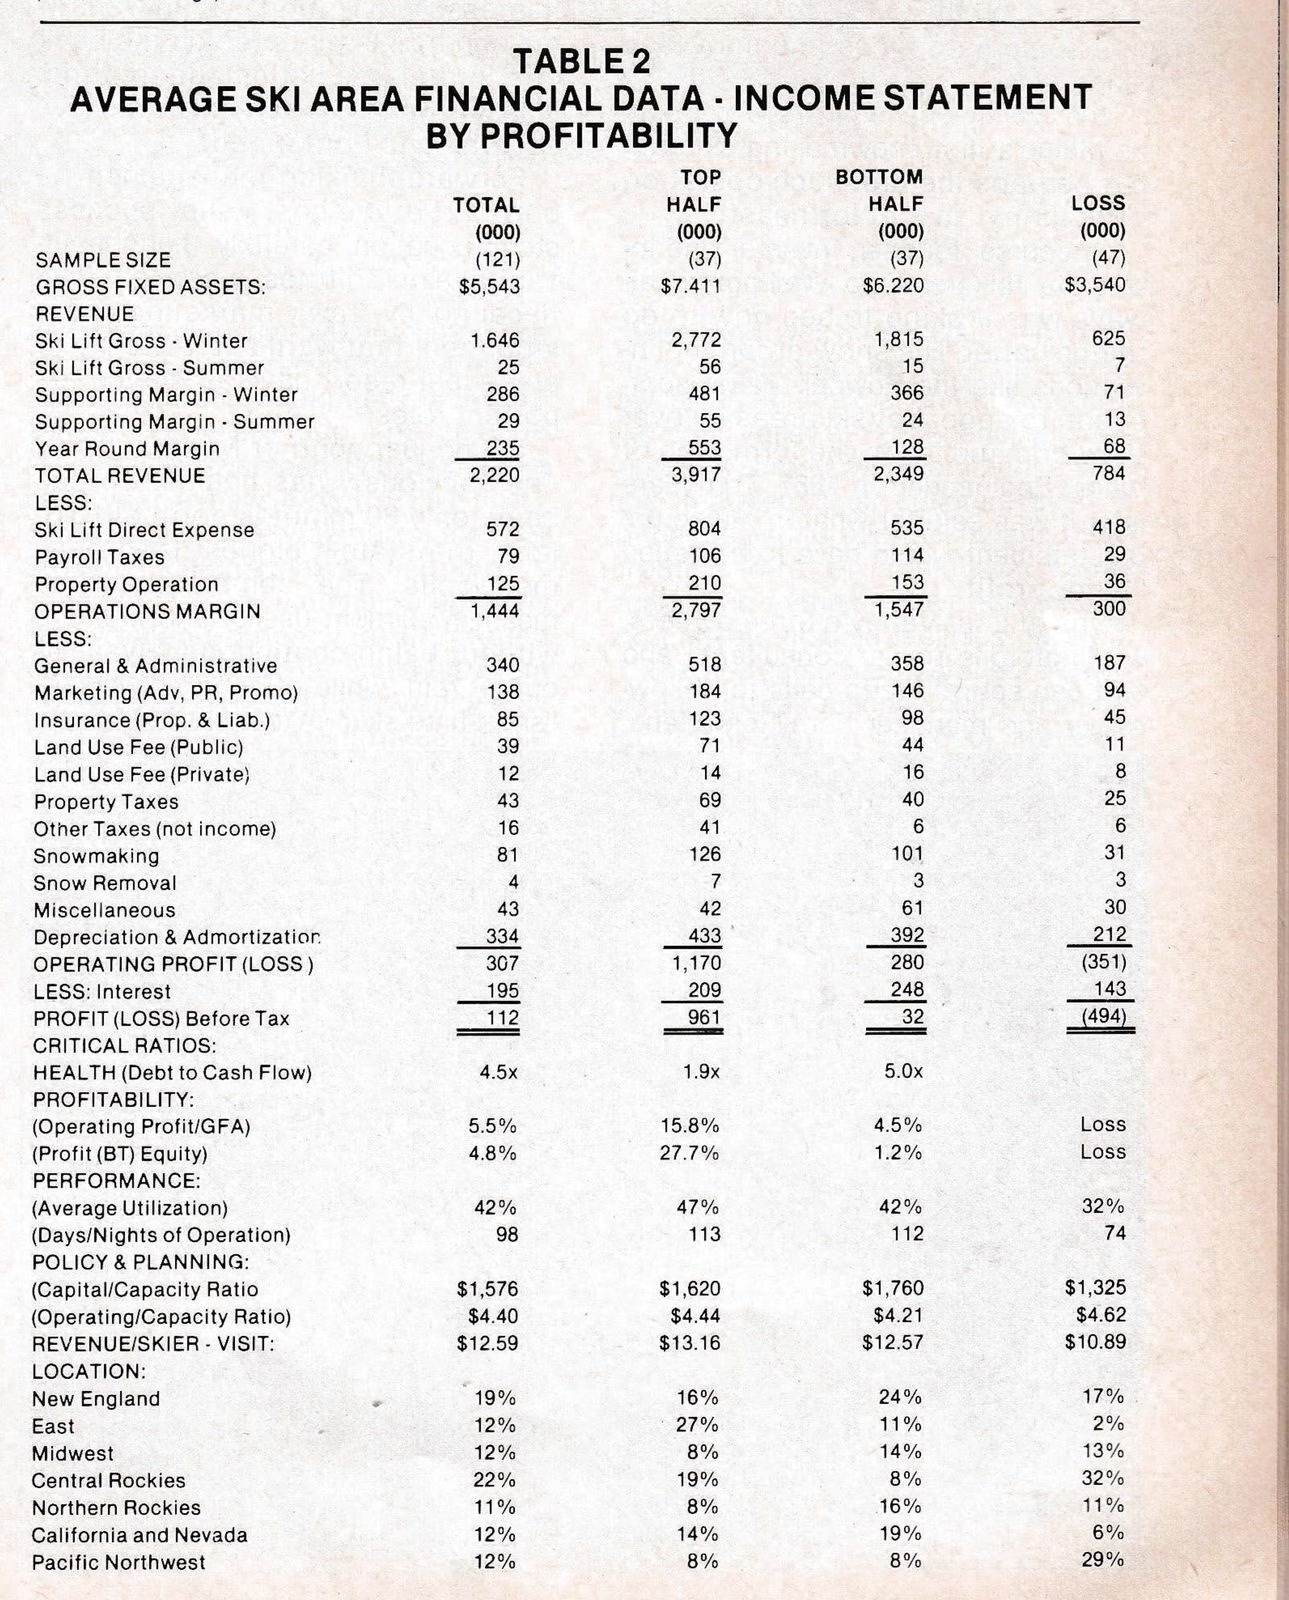
Table 2 is a consolidation of the base data, critical ratios and location of the 1980/81 ski area respondents by profitability levels. Those areas posting losses suffered a quadruple whammy. Their major problem was a short operating season. This was compounded by low average utilization, a lower than average revenue and finally, an above average operating cost capacity ratio. The major reason for the lesser performance of the bottom half of the profitable areas was a lower utilization rate. Of the loss areas 78% were located west of the Great Plains, whereas 51% of the top half of the profitable areas were east of the Rockies. It should be noted here that the five year average operating profit of GFA for the top half of the profitable ski areas is a strong 20.1%, and exceeds the 18.0% that I judge adequate to attract investment.
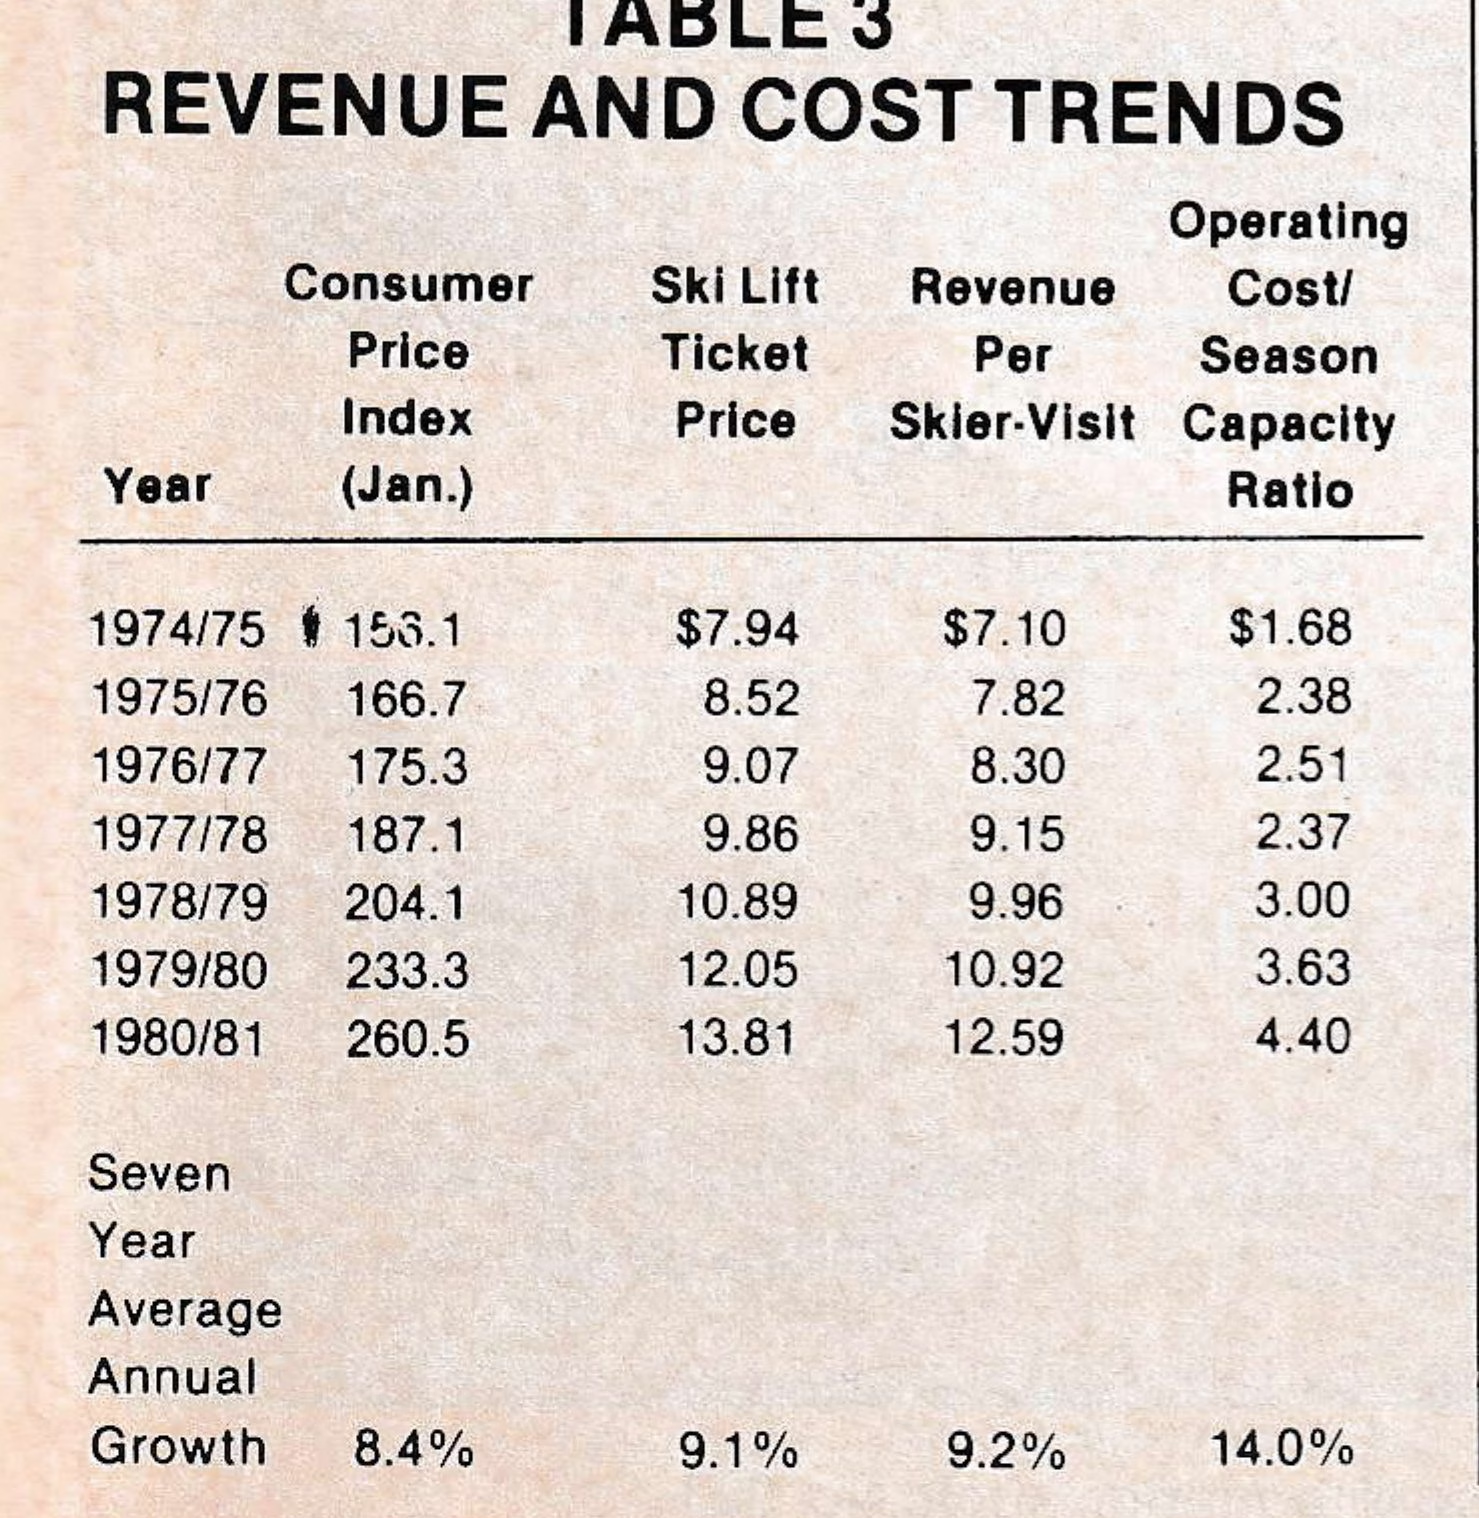
The operating cost/season’s capacity ratio again jumped 21%. Table 3 shows the trends between revenue and operating costs as compared to the consumer price index. Much of this cost increase can be attributed to heroic efforts on the part of ski area staffs to provide acceptable ski conditions when nature failed to cooperate. In spite of this explanation, it appears to me that operating costs are still outstripping both revenues and the consumer price index. Unfortunately, when combined with poor winter weather, a short season and below average utilization, it helps produce the recorded operating loss. Since it does not appear possible to increase lift ticket prices any more than the historic 9.1% average rate, areas must study methods to at least reduce the increase in operating costs.
The 1980/81 study is the thirteenth annual study and the eighth produced by Business Research Division at the University of Colorado. The study is conducted for the Economic Studies Committee of the National Ski Areas Association. The report contains 10 chapters and 89 tables of data. Copies of the 1980/81 Economic Analysis of North American Ski Areas may be obtained from the Business Research Division, University of Colorado, Boulder, Colorado 80309. The cost is $40 per copy.