


Remote avalanche control systems (RACS), as the name implies, enable avalanches to be explosively triggered remotely, thus avoiding the need to put ski patrol or highway avalanche control personnel in harm’s way. They have been widely deployed in Europe, and installations are becoming more and more common in the western United States and Canada with the Department of Transportation and at ski areas. In some situations, RACS are taking the place of artillery rounds to remotely initiate avalanches without the hazards of shrapnel, or the potential for trajectory mishaps.
Since much of the performance data on RACS has been compiled by the manufacturers themselves, or by researchers collaborating with device manufacturers, an independent study to evaluate RACS performance was needed. That led the U.S. Department of Transportation (USDOT) Transportation Avalanche Research Pool (TARP), a partnership of entities from the western United States and Alaska, to contract with Montana State University (MSU) researchers in November 2019 to produce a study that would enable comparisons between systems.
I was the project lead on that study, with support from researcher Brandt Seitz, MSU professor Daniel Miller, and others. Although recently retired, as an associate professor in MSU’s Mechanical Engineering department, I worked on projects involving avalanches and snow dynamics for more than 20 years.
The goal of this effort was to evaluate the blast characteristics from operational RAC systems, and then publish project results for use by avalanche practitioners. The basic project task was to record accurate air pressure measurements of the blast wave, or “overpressures,” for each of several RAC systems. Here, I’ll break down the systems evaluated and the study methodology so that avalanche control practitioners can better understand how to use this data as they consider avalanche mitigation options for their ski areas.
THE SYSTEMS
RAC systems can be based on either explosive gaseous mixtures or solid explosives. Of the systems analyzed in this study, the Gazex and O’Bellx, both from French corporation TAS, use gaseous mixtures, while the Wyssen Tower, from Swiss manufacturer Wyssen Avalanche Control AG, uses solid explosives. We also did some limited testing using explosive charges to simulate the Avalanche Guard system, a solid-explosive based system from Swiss manufacturer Inauen-Schatti AG.
These different RAC systems all effectively perform avalanche control activities without endangering workers. But each system has unique characteristics, various explosive effects, and operational advantages and challenges.
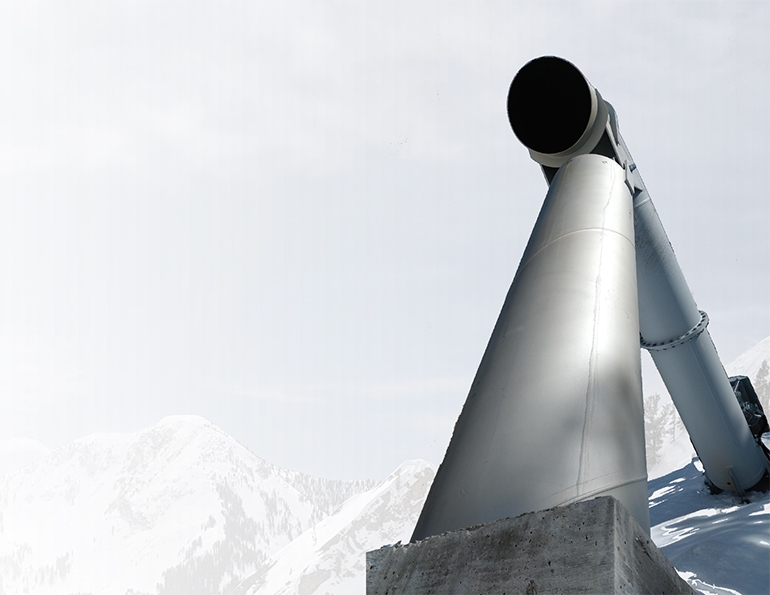
The Gazex system uses a mixture of oxygen and propane that is metered into a reinforced steel tube and then remotely ignited. The tubes are permanently installed on concrete supports in an avalanche starting zone. Oxygen and propane tanks are housed in a separate on-mountain storage location, and gas lines are run to one or more Gazex units. The number of firings is limited only by the local gas supply. Numerous Gazex installations of three sizes (0.8, 1.5, and 3.0 cubic-meter gas capacities) are present in the western U.S. and Canada.
 Testing was done on a UDOT Gazex 1.5 in Little Cottonwood Canyon, above Utah Highway 210. The Alta Ski Area parking lot is visible to the left.
The O’Bellx system utilizes an oxygen and hydrogen mixture contained in storage cylinders held around the perimeter of a bell-shaped explosion chamber. The unit is delivered by helicopter to a tower permanently installed in an avalanche starting zone. On remote command, the metered gas charge is released into the bell and ignited. The gas supply lasts for approximately 30 firings. When gas is depleted, the helicopter retrieves the bell with a custom long-line gripper and flies to a location where the gas can be replenished. An alternative to the fixed unit is the Daisy Bell, which is flown by helicopter to a starting zone where the shot is made with the unit hanging below the chopper.
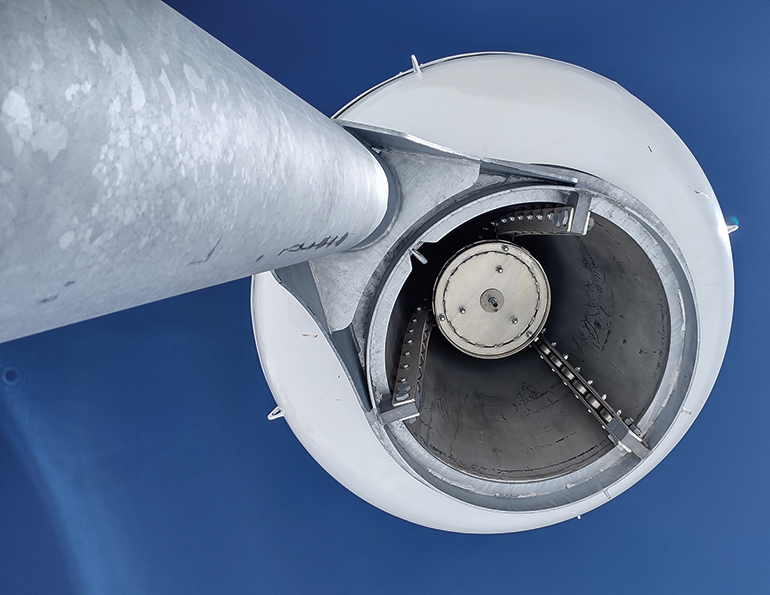 An O’Bellx system at Alta Ski Resort, Utah.
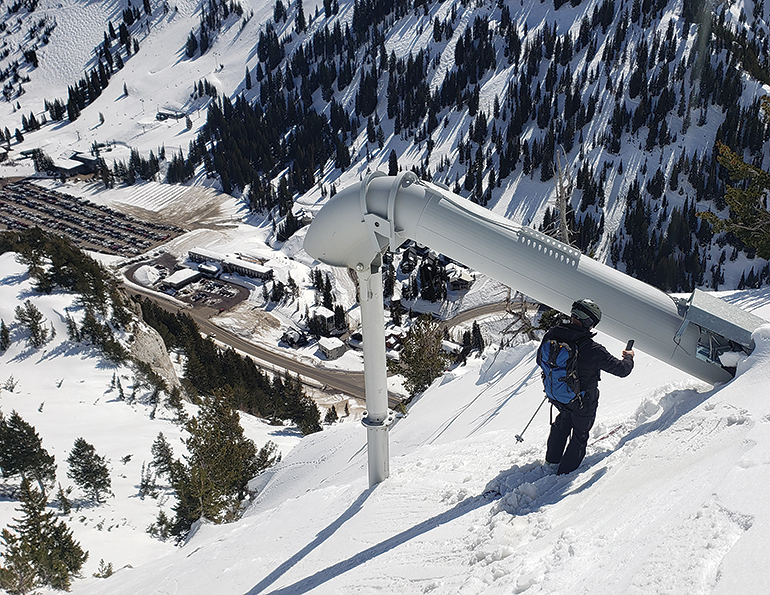
 This Wyssen Tower system in Little Cottonwood Canyon, Utah, uses solid explosives.The Wyssen Tower system uses gel or solid explosive charges. A permanently installed tower in the starting zone is specially designed to receive and hold a helicopter-delivered magazine containing 12 charges. Upon remote command, a tethered charge is released from the magazine. An igniter activates when the charge hits the end of its lanyard, where it hangs and detonates at a predetermined height above the snow surface. The Utah Department of Transportation installed the first U.S. Wyssen Tower system in Little Cottonwood Canyon in 2018.
The Avalanche Guard uses a remotely actuated pre-loaded mortar to launch solid-explosive charges from a permanently installed tower. The charges land in the predetermined target starting zone up to 200 meters from the tower and detonate within the snowpack.
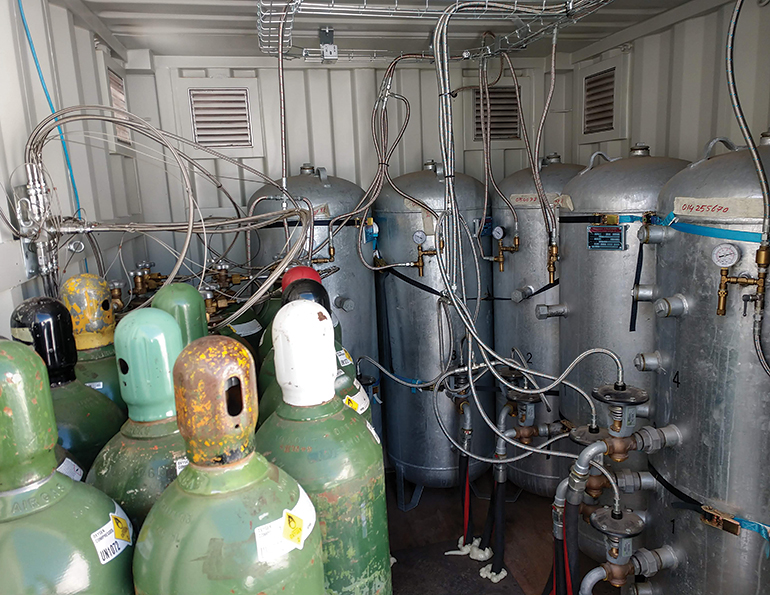 Gazex on-mountain oxygen/propane storage in Little Cottonwood Canyon, Utah.
TESTING
Testing equipment was validated in December 2020 with assistance from the Bridger Bowl Ski Area, Mont., ski patrol, in Phase 1 of the study. Phase 2, the crux of the project, involved multiple trips to Utah’s Little Cottonwood Canyon and Alta Ski Area as well as Colorado to test actual Gazex, Wyssen, and O’Bellx exploders as well as explosive charges designed to simulate Avalanche Guard rounds. This testing took place January–April 2021, with follow-on testing in Colorado in May 2022.
Blast data was logged at different distances and in different directions from the RACS shot to allow calculation of the peak pressure, the rate of pressure rise, the energy at a given distance, the shape and distance of the blast effect, etc. These measurements allow us to evaluate the effective envelope of these systems, which are intended to induce a compressive failure in a weak snow layer. Many researchers consider the peak pressure and the pressure rise rate to be important factors in causing that compressive failure.
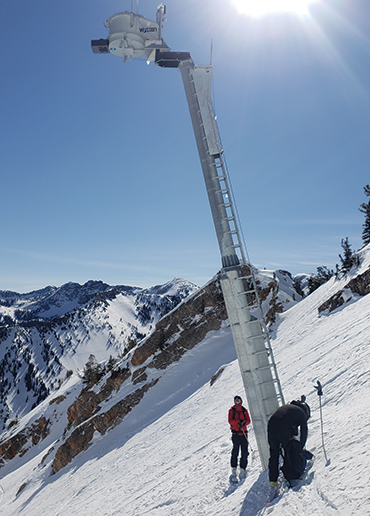
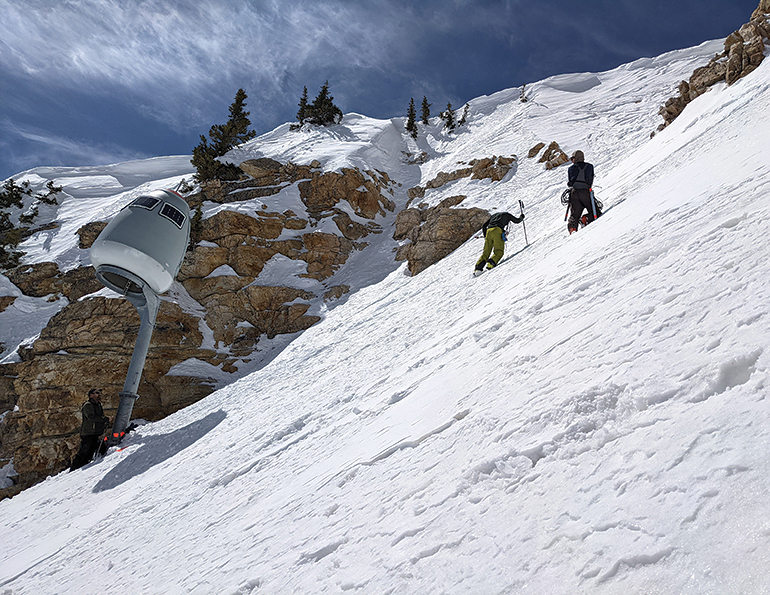 Testing an O’Bellx gas-based system at Alta Ski Area, Utah.
Generating an explosive “overpressure” loads an area of the snowpack with many, many pounds of force. If the peak force is too low, there isn’t enough load to cause collapse. Also, the pressure drops off the farther you get from a blast—in other words, the blast energy dissipates with distance, and the compressive effect drops off as well. Pressure rise rate, or how fast the pressure rises from the ambient pressure to the peak pressure, is also important. If the rise rate is too gradual, there may not be enough of a shock to the weak layer to initiate failure.
Some of the RACS, such as Gazex and O’Bellx, “aim downhill,” so the blast is not symmetrical. The Wyssen and Avalanche Guard systems are less directional and more (but not completely) spherical.
Of course, avalanche control is an inexact science—generating an overpressure load sufficient to set off a slide is highly dependent on the characteristics of a changing, variable snowpack. Depending on conditions, a local collapse can sometimes propagate to affect a larger area, like when a relatively lightweight skier or rider, in certain snowpack conditions, generates a large avalanche that cracks across great distances.
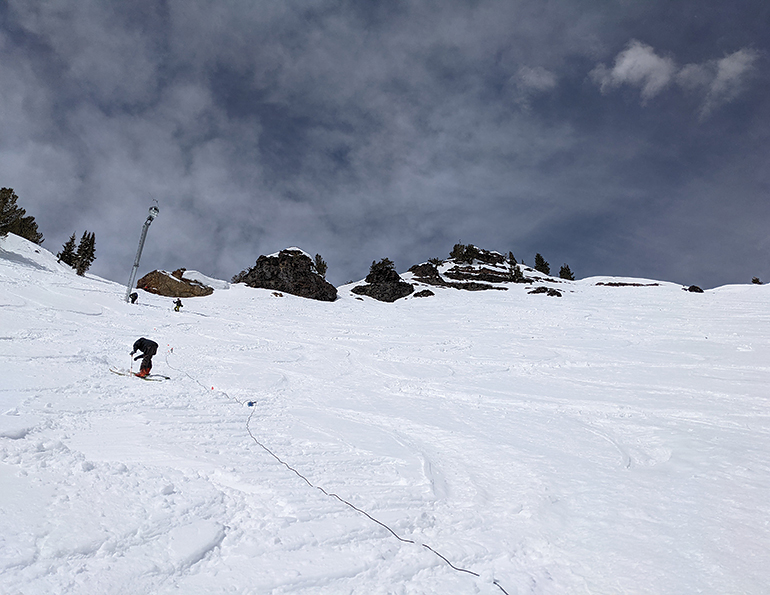 Setting up sensors to measure a blast in Little Cottonwood Canyon.
Terrain variations. In Phase 3, to explore how the terrain affects the blast intensity and distribution, the team tested installed systems and representative explosives in sites near terrain features such as cliffs or gullies. Those results confirmed that terrain can be used to affect blast intensity.
For example, data from a test shot positioned in a gully feature showed that pressure rise rates directly down the gully (the 0° axis) were approximately double those recorded in flat field testing with the same explosive. But relatively lower peak pressures and pressure rise rates were observed in a lateral direction. This showed that the terrain feature increased the directionality of the blast.
Since an infinite number of terrain variations are possible, definitive conclusions that could be applied universally are not possible. However, a pressure measurement system could be used to map the blast patterns at proposed terrain-affected installation sites before a RACS is installed to ensure maximum effectiveness.
READING THE DATA
All told, we collected and processed approximately 375 pressure records, with about 1.125 billion discrete data points. The complete record of all data is available in table form for researchers to use, but, fortunately, many of the project results can be represented graphically—a more user-friendly tool for those looking to understand RACS performance. Here’s an overview of the types of graphs developed from the data and how to read them.
Maximum pressure graph. This type of graph plots the maximum pressure seen by each of several pressure sensors located on a common axis, at various distances from the explosion. The graph includes a dashed line marking 0.145 PSI, or 1 Kilopascal (KPa). Some researchers have proposed this pressure value is the minimum pressure needed to collapse a weak layer, initiate fracture, and induce an avalanche. Not all experts agree, though, and the 1 KPa pressure value is not an absolute indication of effective system range. But identifying the distance where this value occurs provides a standard to compare the relative performance and blast patterns of different RAC systems.
Pressure decay plots from several angles can be plotted together, with lines of equal pressure added to resemble a topographical map of the blast characteristics, such as directional pressure. Intensity of the blast (psi) is indicated by color, and on these maps, the dashed line indicates the 1 KPa distance.
These contour plots can also be shown as 3-D “volcano plots,” where color-coded blast intensity appears as height, mapped against distances from the explosion. Volcano plots aid in the visual interpretation of the 2-D “topo” plot results.
Results have been compiled for every test scenario in these three types of plots, providing graphical results that can be compared to aid in RACS selection, placement, and usage. The important thing here is how the peak blast pressures decay with distance down to (and below) the 1 KPa level. (Examples of these graphs can be found online at saminfo.com/RACS.)
IMPLEMENTATION
The study was designed to provide avalanche control experts with useful information on operational RACS so they could make more informed decisions on using these modern technologies. In general, the project results successfully addressed that need. The results are not all-encompassing, though, nor do they address every conceivable RACS implementation.
Further, the economics and operational decisions that could drive RACS implementation choices were outside the scope of the project. Also, in certain snowpacks, a localized failure in a weak layer can propagate widely and affect a large area, and the RACS overpressure zone area may then become relatively less critical. But with those caveats, a few general observations can be made.
Conclusions on system applicability. Of the systems tested in Phase 2, results indicate the peak pressures, energy equivalents, and pressure rise rates were highest for the pentolite-based explosives (Wyssen, Avalanche Guard), followed by the gel emulsion charge (Wyssen), 1.5 m3 Gazex, 0.8 m3 Gazex, and, lastly, the O’Bellx. (Note that the larger Gazex 3.0 m3 system was not tested.) Where the parameters of peak pressure, pressure rise rates, and energy equivalents are deemed the most important for inducing avalanches, a practitioner could draw some conclusions on system applicability:
• Due to its large charge mass and mostly symmetric blast wave profile, the Wyssen Tower, with either the gel emulsion or pentolite-based charge, affected the largest areas of avalanche terrain. These systems may be selected for installation where the downslope, across-slope, and upslope directions are all equally important for avalanche initiation.
• Due to their directionality, individual Gazex systems are perhaps best suited for locations where the potential avalanche starting zones are relatively narrow and elongated downslope of the installation site, and the uphill direction is not seen as an equally likely starting zone. Placing multiple Gazex systems in an array above a broader target area expands that area of influence.
• The O’Bellx system, due to its relatively small combustion chamber volume and more limited effective area, might be best used in a relatively small zone where a localized and reliable weak spot or trigger point is known.
Phase 3 testing confirmed that terrain can meaningfully alter the blast wave effects of an explosive, and that current avalanche control practices making use of unique terrain features have merit. For example, data from a simulated Wyssen pentolite test shot detonated on a bamboo pole in a gully showed that pressure-rise rates directly down the gully (the 0° axis) were about double those recorded in flat field testing with the same explosive. However, relatively lower peak pressures and pressure rise rates were observed in a lateral direction (on the 45° axis.) So, the gully increased the directionality of the blast.
A simulated Wyssen pentolite shot detonated on a bamboo pole near a cliff displayed a slight increase in both peak pressure and energy equivalent directly downslope of the blast (along the 0° axis) when compared to flat field testing. As with the gully test, the pressure and energy equivalent values measured on the 45° axis and at 90° to the blast were relatively lower than those measured in a flat field situation. The cliff feature clearly enhanced the downslope directionality of the blast.
However, for a variety of reasons, the terrain-effect portion of this study was limited to a few cases, and more thorough investigations at individual sites are needed to flesh out these results.
Where to access this data. Much of the project, including a thorough presentation of results, is documented in researcher Brandt Seitz’s master’s thesis, available through the Montana State University library. The results have also been shared in presentations at the Utah and Colorado Avalanche Workshops, meetings with device manufacturers, and communications with researchers and practitioners in the U.S., Canada, and Europe. The final report with a complete results compilation was submitted to the TARP team in June 2022.
The information gleaned in the project should be beneficial to avalanche control practitioners and others who want to understand the capabilities, limitations, and possibilities for implementing RACS.