


For the fourth year in a row, the Net Promoter Score for member ski areas reported by the National Ski Areas Association provided further evidence that sharply lower levels of guest satisfaction and loyalty are the new normal. Data from the 2024-25 Kottke End of Season and Guest Experience Report showed the most recent four-year average NPS of 66.25 is more than six points lower than the 72.5 average for the previous six years. The industry’s future is dependent on the guest experience, so it’s time to acknowledge that the industry does have a problem, to identify the root causes, and refocus efforts on enhancing the guest experience.
In the May 2024 issue of SAM, I posed the question in the title of my article, “Is Lower Guest Satisfaction & Loyalty the New Normal?” The article highlighted the sharp declines that had occurred in NSAA’s national Likelihood to Recommend NPS and various satisfaction ratings during the 2021-22 and 2022-23 seasons. In its 2022-23 Kottke End of Season and Demographic Report, NSAA reported an NPS of 66, the second consecutive season it was well below the peak of 74 recorded in 2020-21. The report cautioned that the “stagnant NPS should remain a concern of the industry.”
For that article, I reached out to industry leaders and found that awareness of the declines was low, and that concerns were minimal. Most explained away the declines as transitory and not a new normal.
I did not share their lack of concern. Based on their input and a deeper study of the Kottke Report and its research tables as well as Guest Research survey data from our clients, I suggested a variety of possible reasons for the declines. These included record skier visits and overcrowding during weekends and holidays, reduced services and labor shortages, window ticket price resistance, higher guest expectations, and reduced emotional engagement of guests.
This was just ahead of the release of the 2023-24 Kottke End of Season and Guest Experience Report (appropriately renamed to reflect more than guest demographics). That report revised its 2022-23 NPS to 68 but reported the 2023-24 NPS had dipped again to 66, the third consecutive season in the 60s, each well below the 2020-21 peak. Then came July’s release of the 2024-25 Kottke Report, with an NPS stagnant at 66.
Now, with four consecutive seasons in the mid-60s, it is clear that the lower levels of guest satisfaction and loyalty are the new normal. Over time, this will likely lead to a lower conversion rate of first-timers into core skiers, fewer lapsed skiers continuing with the sport, reduced visit frequencies and fewer skiers recommending the sport to others.
Overall Guest Experience Metrics: To analyze the guest experience portion of the 2024-25 Kottke Report, I’ll focus on the two most important overall guest experience metrics: the Net Promoter Score (NPS) and the Overall Visit Experience/Satisfaction score (often referred to as “CSAT” for Customer Satisfaction Score).
The two metrics measure very different things. NPS measures guests’ loyalty, that is, their relationship with the ski area, which is queried with the Likelihood to Recommend question. NPS is based on all previous visits the guest has made to the ski area, along with all other interactions and communications the guest has had with the ski area, and it requires an emotional engagement.
CSAT, on the other hand, is queried with the Overall Visit Satisfaction question and measures guests’ overall satisfaction only with their most recent visit. It does not measure guests’ emotional engagement with the ski area.
Let’s review scores for these two metrics.
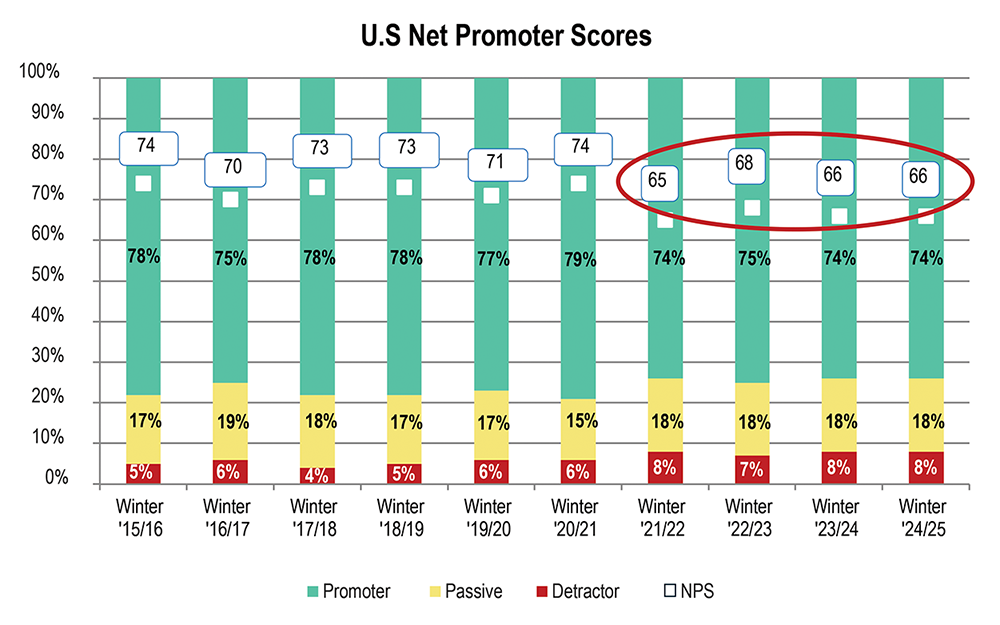 This chart illustrates a trend in average NPS scores for U.S. ski areas, which have dipped into the 60s the past four years. Source: NSAA Kottke End of Season and Guest Experience Report.
Net Promoter Scorecard
As mentioned earlier, U.S. ski areas’ 2024-25 NPS of 66 was unchanged from the prior season and was only one point higher than the 10-year low of 65. For the most recent four seasons, the national NPS averaged 66.25, down more than 6 points from the previous six years’ average of 72.5. Comparing these same two periods, the Promoter percentage declined by more than 3 points, while the Detractor percentage grew by more than 2 points.
While the ski industry’s recent NPS remain well above many other industries, the decline cannot be ignored, and it is not a healthy trend for an industry that seeks to continue growing and had previously enjoyed a decade of scores in the 70s.
There will still be varying opinions about how serious this decline is and how the trend can be reversed. This season’s Kottke Report even describes the downward trend as only a “modest decline from peak levels of 70-74 ...” This is a significant understatement, given the decline exceeds 6 points, not 2 or 3. It’s time to conduct a root cause analysis to determine why this is happening, and quickly begin to address the problems the analysis finds.
Which regions and ski area sizes depressed the 2024-25 Net Promoter Scores?
Loyalty was highest in the Midwest. Regional Net Promoter Scores were 73 for the Midwest, 70 for the Northeast, 69 for the Rocky Mountains, 66 for the Pacific Southwest, 59 for the Pacific Northwest, and 28 for the Southeast. Scores for the Southeast and Pacific Northwest have declined steadily since the peak NPS season of 2020-21, by 33 points and 8 points, respectively. One potential reason for the big drops could be the low numbers of participating ski areas and completed surveys. The Rocky Mountain region is also 8 points lower than its peak.
Rockies, Southeast led the decline. According to NSAA, the Rocky Mountain region accounted for 43 percent of the national skier visits this past season, followed by the Northeast at 20 percent and Pacific Southwest at 13 percent, while the Southeast, Pacific Northwest and Midwest each contributed less than 10 percent. To approximate regional contributions to the national NPS declines that occurred between 2020-21 and 2024-25, we weighted each region’s four-year decline by its percentage of skier visits this past season. Doing so reveals that the Rocky Mountain and Southeast regions were responsible for 3.4 points and 2.4 points, respectively, while the Northeast was responsible for 1 point.
The main culprit: extra-large areas. For the ski area sizes, 2024-25 Net Promoter Scores ranged from 69 for the large ski areas to 60 for the medium ski areas, a much narrower range than for the regions. Notably, since 2020-21, the NPS for the extra-large ski areas declined by 14 points, from 80 to 66. This is critical, because the extra-large ski areas accounted for 55.5 percent of national skier visits last season, dominating the industry.
To approximate the contributions to the NPS declines by ski area size, we did a similar weighting and calculated that the extra-large ski areas accounted for three-quarters of the national NPS decline.
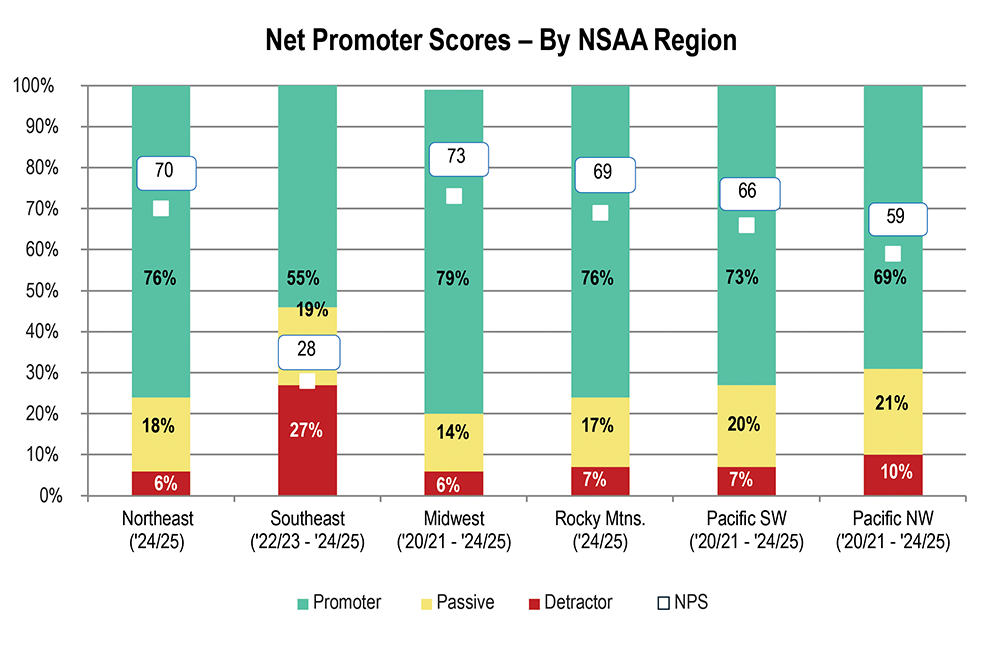 The Midwest region led the way nationwide and the Southeast was well below other regions. Source: NSAA Kottke End of Season and Guest Experience Report.
Overall Visit Satisfaction Scorecard
The trend in Overall Visit Satisfaction scores is less clear. NSAA only added the CSAT question to its survey and reporting two years ago, so trends are not yet emerging. More important, the scores for overall satisfaction and all other satisfaction ratings are based on mean (average) scores, which we find difficult to interpret. Unlike NPS, which is calculated by subtracting the percentage of Detractors from the percentage of Promoters, the means measuring the satisfaction attributes are calculated by totaling the scores and dividing the sum by the number of responding ski areas. The strength of those who like and dislike an experience is camouflaged because of the averaging.
While CSAT is a reliable measure of overall satisfaction with the most recent visit, it is generally not considered a reliable predictor of business results because, unlike NPS, it does not measure the guest’s relationship with the ski area.
The Kottke Report says that Overall Visit Satisfaction “earned a strong national rating of 8.7 this past season, down slightly from 8.8 the previous year.” The report doesn’t indicate whether the difference is statistically significant or not. However, since loyalty requires satisfaction and an emotional connection, lower satisfaction would be a drag on loyalty.
The “other” satisfaction scores: Using means, NSAA tracks seven additional satisfaction attribute ratings and the Likelihood to Return to the same ski area. Each of the seven satisfaction scores was either unchanged from the prior season or +/- 0.1 point. All ratings were between 8 and 8.9. As is typical for the ski industry, the lowest ratings were for Value for Price Paid (8.2) and Overall Food & Beverage (8.0).
Similar to the NPS Likelihood to Recommend scores, the Likelihood to Return scores were lower in 2024-25. Longer term, the average for the last four years was 68.75, down from 70 for the previous six years.
Comparisons to Guest Research’s clients: For additional perspective, we compared the Kottke Report’s ratings for NPS and Overall Visit Satisfaction to those of our clients. Our consolidated ratings are for U.S. and Canada ski areas, while NSAA’s are for the U.S. only. Our ratings are simple averages, whereas Kottke’s are “weighted by resort and by NSAA region.” Our sample consists of a mix of small, medium, and large ski areas with fewer extra-large ski areas and relatively more Northeast ski areas than are included in the Kottke Report.
For the three years following the U.S. peak NPS of 74 in 2020-21, our clients’ ratings were within one point of the Kottke results. This past season, our clients’ NPS rose 2 points to 68 while the Kottke showed an unchanged 66. Similarly, while both the Kottke and our clients’ average Overall Visit Satisfaction in 2023-24 was 8.8, the 2024-25 national average in the Kottke Report went down to 8.7 and our clients’ rose to 8.9.
Our clients can view their real-time ratings based on three scoring methods—Net Promoter scoring, means, and “Top Box” (the percentage of 9 and 10, or “Excellent” ratings, the most favorable response). We prefer Net Promoter scoring for all attributes. It has numerous advantages, including identifying the Promoters who support a ski area through higher visit frequency, higher referrals, and higher spend and the Detractors who harm a ski area because of a lower repeat rate, lower visit frequency, lower spend, and a higher cost to service.
It’s also easier to encourage staff to increase the number of guests who really like you and to decrease the number of those who do not than it is to ask them to increase a rating from, say, 7.1 to 7.2. This enables a ski area to make real-time service adjustments throughout the season to enhance its year-end scores. Our 2024-25 increases in NPS and Overall Visit Satisfaction reflected the gains in our “other attribute” ratings, many of which realized three- to six-year highs.
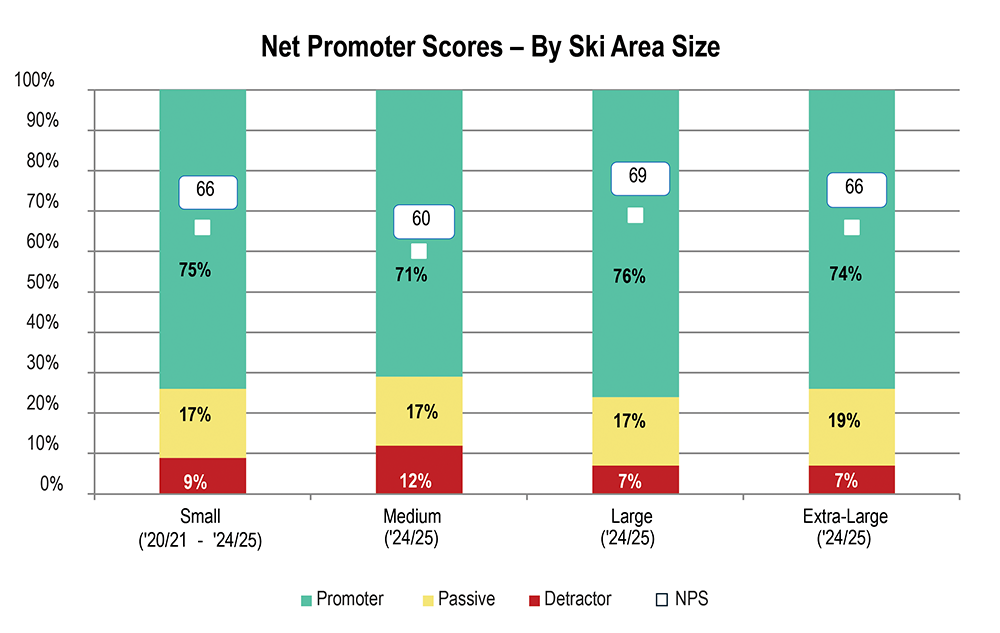 NPS by ski area size shows all four categories are relatively close in scoring. Source: NSAA Kottke End of Season and Guest Experience Report.
The Importance of Emotional Connection
Widespread research over the past 10-15 years has confirmed that consumers base their decisions, including brand selection, on emotion, and then justify those decisions with logic. (See “How Does that Make You Feel?” SAM, March 2024, for more on this topic.) The primary difference between Promoters and Passives is emotional engagement; Promoters are emotionally engaged with the ski area, while Passives and Detractors are not.
Emotions—in particular, happiness and fun—are among the leading drivers or determinants of both Likelihood to Recommend and Overall Visit Satisfaction, along with the Overall Ski/Snowboard Experience. For these reasons, we track up to six specific emotion attributes in our guest surveys, and we continue to urge NSAA to measure emotional engagement with its guest surveys as part of the National Guest Experience and Demographic Study conducted by RRC with the results summarized in the Kottke Report.
For four years, our guests have been telling us that their ski experience is no longer what it used to be. While it’s always good, it’s not always great. If your ski area’s ratings mirror the industry’s declines, it’s time to increase the focus on enhancing the guest experience and reverse these trends.
Suggestions for Ski Areas
Some suggestion to help enhance ski areas’ guest experience:
1. If not already measured, add questions to the guest survey to measure both NPS and Overall Visit Satisfaction. The focus should be on boosting those outcome scores by improving the scores for the other satisfaction and emotion attributes that are highly correlated with the two outcomes.
2. Since emotional engagement is critical to guests’ loyalty and NPS, ski areas need to measure guests’ emotions. Add these two emotion questions to the guest survey at a minimum: “Happiness with the Visit” and Overall Level of Fun. Increasing the fun guests have will make them leave happy, and happy guests will return and recommend you to their friends and colleagues.
3. Ski areas that are unable to compare their Likelihood to Recommend and Overall Visit Satisfaction ratings to a competitive set should compare their ratings to the Kottke Report’s national and regional scores. If your 2024-25 scores mirror national declines or are lower, the data should be dissected to determine the reasons. (For more on this, see “Is Lower Guest Satisfaction & Loyalty the New Normal?” SAM, May 2024.)
Net Promoter® and NPS® are registered trademarks of Bain & Company, Inc., NICE Systems, Inc., and Fred Reichheld. Net Promoter ScoreSM is a service mark of Bain & Company, Inc., NICE Systems, Inc., and Fred Reichheld.