


The National Ski Areas Association’s Economic Analysis of United States Ski Areas for 2017-18 overflows with information about the state of the ski industry. An interested reader could easily spend a week digging through the data, which is presented not just for the industry as a whole but also for regions, size categories, and region/size combinations. All these smaller slices are rich with data.
This article summarizes the key nationwide findings of the report and offers suggestions to readers who don’t have a week to dig. Before we do that, though, a few caveats:
• The Economic Analysis presents 2017-18 season data and compares it to 2016-17 data. It’s difficult to draw definitive conclusions about the long-term health of the industry because of its short-term volatility. However, NSAA and the team at RRC Associates, Inc., which produces the report, do an excellent job of making those year-to-year comparisons as useful as possible.
• This year’s Economic Analysis includes a new feature: comparisons to data from 10 years ago. The 2007-08 data doesn’t cover the same set of resorts as the 2017-18 and 2016-17 data, though, so it’s not apples-to-apples in the same way the year-to-year comparisons are. The 2007-08 season was strong; it saw 60.5 million skier visits, roughly 10 percent more than 2017-18 and 2016-17. This was the last season before the Great Recession hit. Still, the comparisons help illustrate the industry’s growth and some key changes.
• The jumbo-sized Rocky Mountain resorts dominate the nationwide results.
The Bright Side
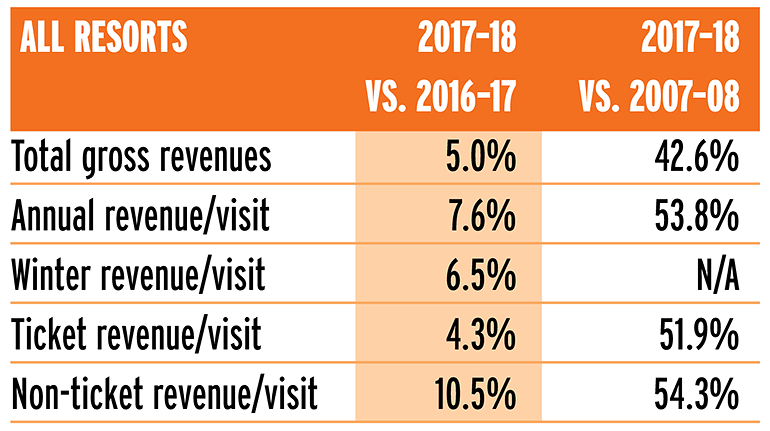
Total gross revenues were up in 2017-18 by 5 percent over 2016-17 and up 42.6 percent from 2007-08. That number is for all the resorts the report covers. Other revenue measures were up as follows:
The Not-So-Bright Side
Total expenses for 2017-18 were 7.2 percent higher than in 2016-17. The biggest expenditure categories in 2017-18, as a percent of revenue, were: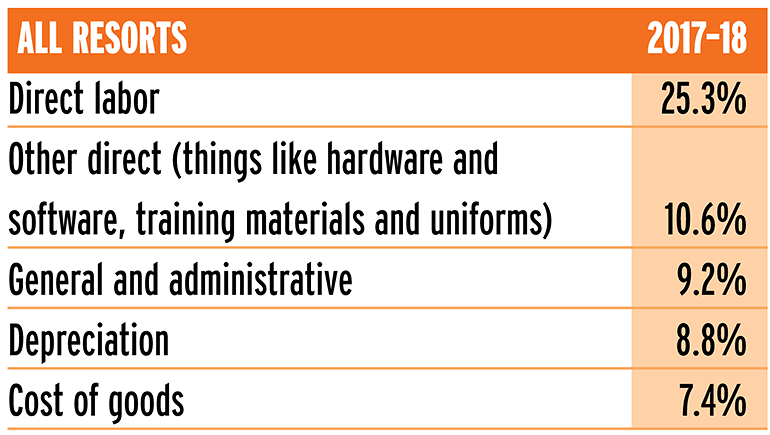
Expenses in every one of these (and several other) categories increased year-over-year.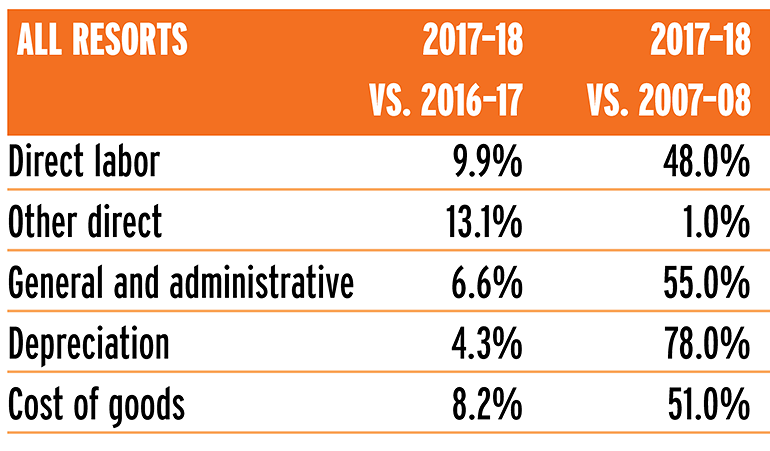
The Bottom Line
So, pre-tax profit margin declined by 5.3 percent. A single year’s profit margin is not all that matters to someone running a business. Other things that matter might include strategy, making capital investments and adjusting to external forces. For a ski resort manager, strategy might focus on how to compete with other entertainment and recreation options; investments include lifts, plows and other technology, and external forces include regulation and climate change.
Still, the intent is to maximize long-term value, and accumulated profits are simply the sum of the profits made in a series of single years. That makes a single year’s profit margin pretty important after all.
Shedding Light on Profitability
The Economic Analysis includes several data tables related to profitability that offer valuable insights. These insights don’t provide direct answers to resort managers about how they should or should not be making decisions; rather, the insights offer useful questions managers should ask themselves and their teams.
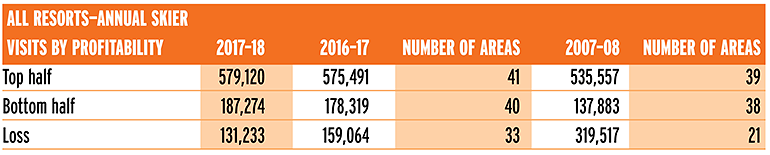
Let’s start with annual skier visits by profitability (below), sorted by top half for profitability, bottom half for profitability, and resorts that reported a loss.
Clearly, the largest resorts have an advantage when it comes to operating at a profit, and have had that advantage over the long term. Note that in 2017-18, 81 of the 114 total resorts, or 71.1 percent, operated profitably. In 2007-08, with a roaring economy and bountiful snow, 77 of the 98 total resorts, or 78.6 percent, operated profitably. It’s hard to draw a definitive conclusion from this data point, but it’s an area for people interested in the long-term health of the ski industry to watch.
Here’s a look at some other profitability-related data: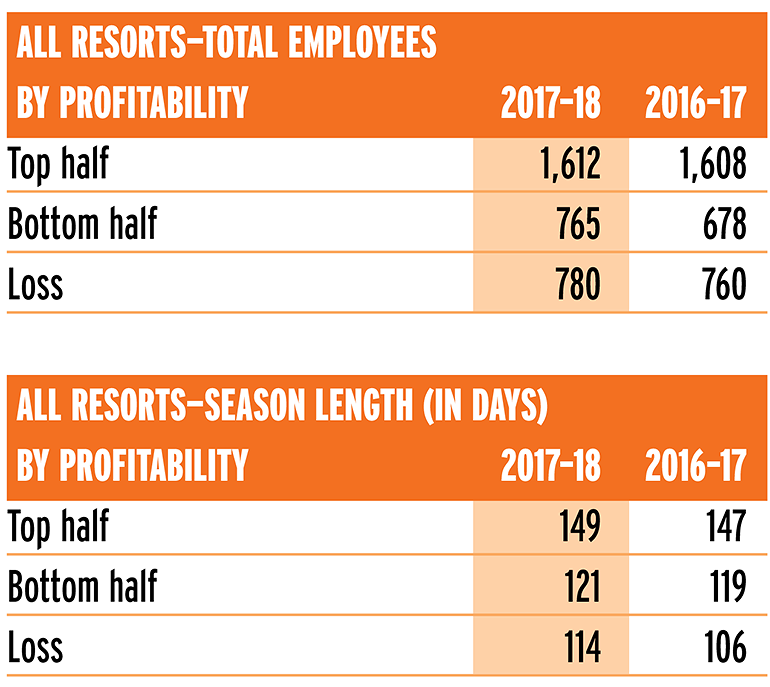
Again, the top half of profitability has big numbers—lots of employees and longer seasons than the less profitable resorts. But the interesting thing is that the differences between the resorts in the bottom half of profitability and those in the loss category are relatively small. Specifically, the top half of profitability has more than double the number of employees, on average, than those resorts in either the bottom half of profitability or the loss category. The bottom half of profitability had fewer employees, on average, than the unprofitable resorts, but only about two percent fewer.
The highly profitable resorts had a longer season than the less profitable resorts, by 23 percent. The less profitable resorts, in turn, had a longer season than the losing resorts, but by only six percent.
What it all means: The data here indicate that the largest resorts have more margin for error in management decisions. That is, they can operate at a profit even if managers don’t obsess over every penny. For everyone else, though, the difference between profit and loss comes down to careful management, especially of expenses.
Revenues Aren’t Everything
Let’s dive a little deeper to see exactly what happened with the expenses at the resorts in the bottom half of profitability compared to those in the loss category. We’ll start with the revenues by department for the two types of resorts.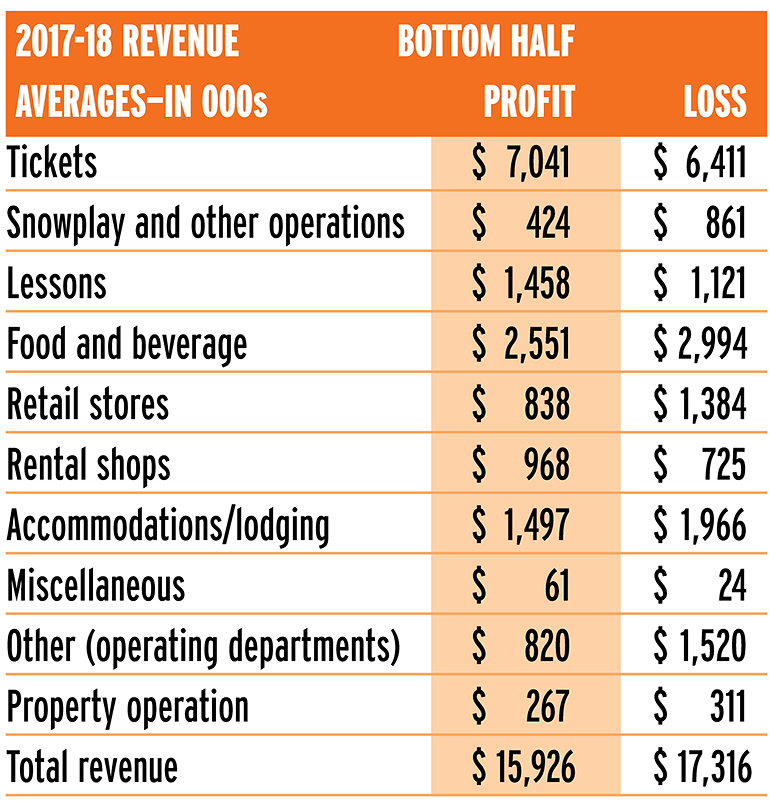
If the labels for the two columns on the right were missing, which resort would you rather run? The one with the higher revenues, most likely. But looking closer, the bottom-half resorts fared relatively well in some key, high-margin areas: ticket revenue, lessons, and rental.
It’s important to know that expenses for the unprofitable resorts were higher in almost every category, including food and beverage, payroll taxes, depreciation and interest expense (se chart, below). Of the 23 expense categories (some of which are common expenses), the unprofitable resorts had lower expenses in just five: lessons, miscellaneous, general and administrative, land use fees–private, and operating leases.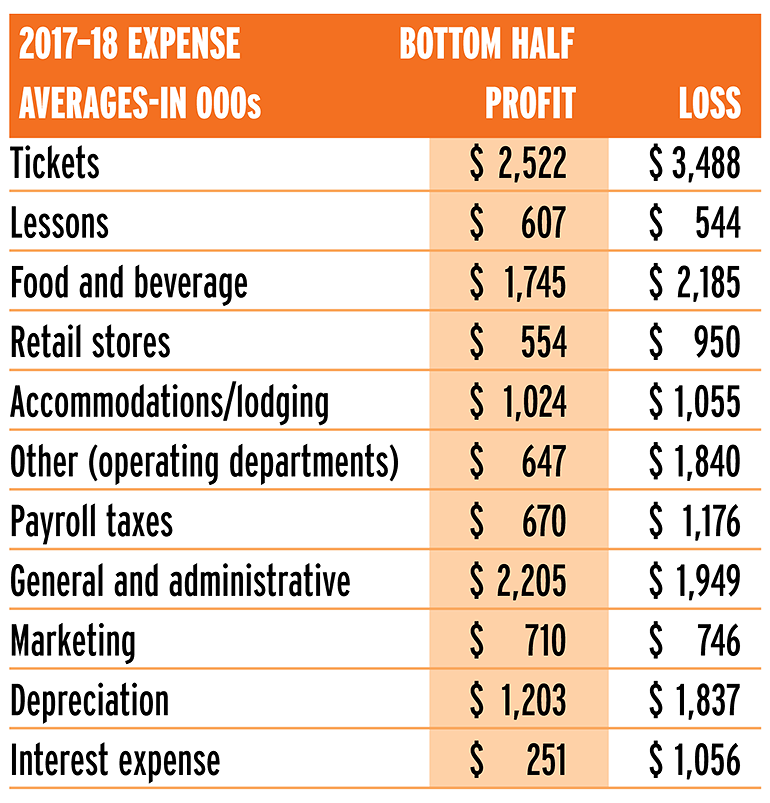
The Challenge of Controlling Costs
So, it wasn’t one or two expense categories that hit the unprofitable resorts hard. It was the cumulative effect of expenses all over the mountain. The big question anyone managing a resort that’s not jumbo-sized should ask, then, is, “What can I do to reduce expenses?”
Sometimes, that question is simple enough to answer; many resorts probably have the proverbial low-hanging fruit of easy-to-cut costs. Sometimes, that question leads to many other questions. For example, payroll tax expense at the unprofitable resorts was nearly double that of the resorts in the bottom half of the profitable category. The unprofitable resorts only had a slightly larger number of employees, on average, than the resorts in the bottom half of the profitable category, meaning the unprofitable resorts spent relatively more on wages.
If the unprofitable resorts want to cut payroll expense, they have to either cut employees, cut wages or both. Cutting wages is probably a difficult option in today’s labor market, with its extremely low unemployment rate. Cutting employees is also probably a difficult option. Unless a resort has a lot of unnecessary employees, reducing staff size could mean reducing service levels and frustrating customers.
This is not to say that resort managers should give up and simply accept operating an unprofitable business. Finding ways to reduce expenses that don’t negatively affect customer satisfaction and, in turn, revenues, is a worthwhile investment that could pay off for years to come. Just remember it won’t often be easy. Investing the time to figure all of it out is hard to do, especially when time is scarce, but it’s a wise investment to make.
A Concluding Note: Summer
Because the Economic Analysis contains so much information, there’s only room for so much in this summary. Many more points are worth discussing here, but only one more will fit.
Summer and fall revenues increased 14.9 percent in 2017-18 compared to 2016-17, and equaled 15.2 percent of total revenues for resorts with summer operations. This comes despite (1) the fact that there was actually a slight decline in the percentage of resorts reporting summer operations, and (2) there was a small decline in the total number of summer visits. Prices for certain activities, then, must have increased, and a sufficient number of visitors must have been willing to pay them. That’s good news for resorts looking to either increase prices for summer attractions or add them. As summer operations grow, though, it will be important to keep expenses at a level that makes those operations profitable.