


In the May issue of SAM, Guest Research, Inc., previewed how ski area visitors responded to the 2021-22 winter season based on our research partners’ Net Promoter Scores (NPS), focusing on the two most important guest experience attributes: “likelihood to recommend” and “overall visit experience/satisfaction.” Broadly speaking, we saw that loyalty suffered during the pandemic, while visit satisfaction fared slightly better.
Here, we’ll take a deeper dive into that feedback and the various factors that drove this season’s ratings.
SUMMARY OF RATINGS AND TRENDS
Season-ending ratings confirmed the preliminary trends noted in the May issue, namely that loyalty, as measured by the “likelihood to recommend” NPS, declined by four points from 2020-21 to 65, and by six points from the pre-Covid year of 2019-20. Satisfaction, as measured by “overall visit experience/satisfaction,” fared slightly better, declining by three points from last season to 60, and even with 2019-20. The highest resort NPS and overall visit satisfaction scores were in the low 80s and high 70s, respectively.
Contributing to the NPS declines, emotional loyalty ratings for “the resort values me as a guest” and “I feel a sense of loyalty to the resort” both declined year-over-year by six points.
Three satisfaction areas retained most of the large gains achieved with Covid protocols in place during 2020-21: overall F&B, overall ticketing, and ease of online purchasing/booking. The steepest declines in satisfaction occurred in overall snow conditions and family appeal.
Most resorts’ satisfaction ratings suffered due to staff shortages and, while this issue was not directly surveyed, the staffing challenges were evident in rating declines for crowding and variety of lifts/trails open. These declines contributed to an increase in complaints about pricing and price/value.
Despite the staffing shortages, overall staff friendliness/helpfulness was essentially even with last season and above 2019-20, which is a real credit to overworked staff members.
DID PROMOTERS DECLINE OR DETRACTORS INCREASE?
A key question in our deep dive was whether this season’s NPS declines traced to a decrease in promoters or an increase in detractors. To answer this, we examined the year-over-year percentage changes in the loyalty categories (promoters, passives, and detractors) for 15 resorts whose ratings suffered larger declines. We found that most of the resorts’ NPS drops were due to declines in the promoter percentages, with only minor increases in detractor percentages. Many guests were simply not as “wowed” during the second Covid year.
This means more guests will look to competitors’ offerings next winter. In response, it is vital to both enhance the guest experience and strengthen the emotional connection with guests so they feel truly valued by the resort.
HOW DID REPEAT GUESTS AND FIRST-TIME GUESTS RESPOND?
Most survey respondents were repeat guests who typically rate their likelihood to recommend higher than first-time guests. This is because they are predisposed to rating their visits more favorably based on their previous visits and decision to return. While every business needs to attract new users, repeat guests offer many advantages:
• Repeat guests are a reliable base inclined to book early and buy season passes, providing early-season revenue.
• They are a built-in sales force that refers their friends and colleagues.
• They require less marketing expenditures to retain, and cost less to service.
Typically, repeat guests’ NPS will be on average five points higher than that of first-time guests, as was the case during the 2019-20 and 2020-21 seasons. This past season, however, with repeat guests’ NPS declining by twice as much as first-time guests’, the difference narrowed to only two points. The ratings and guest comments suggest repeat guests preferred the 2020-21 experience when more Covid protocols were in place and staff shortages were less of an issue.
If your resort had a narrow difference between the repeat and first-time NPS, the key is to determine the reasons for this, and then whether operational and marketing changes need to be made. A review of your detailed ratings, rating changes, and guest comments should hold the answers.
WHICH GENERATIONS ARE MOST LOYAL?
We’ve evaluated the generational breakdown of respondents to determine what differences in loyalty were recorded. The average NPS for the five highest-volume generations are:
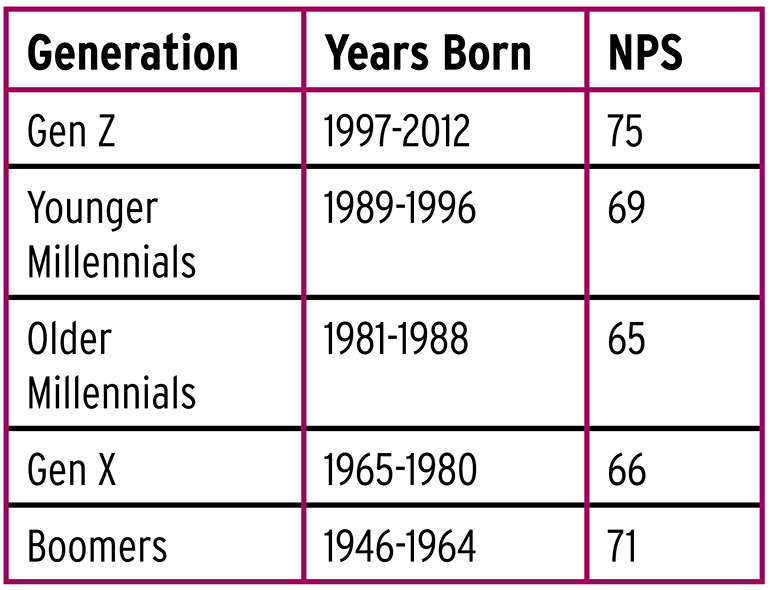
The highest NPS were for the youngest and oldest generations, Gen Z and Boomers. We have broken the Millennials into Younger and Older Millennials based on differences observed in previous years. Ratings for Younger Millennials continue to exceed those of Older Millennials, whose ratings are in line with Gen X. We believe this is because of important lifestyle factors impacting Older Millennials, namely home ownership and couples starting a family. The presence of children in Older Millennials’ households tends to make skiing more complicated and more expensive. This suggests a need to do more to enhance the experience for Older Millennials with young children.
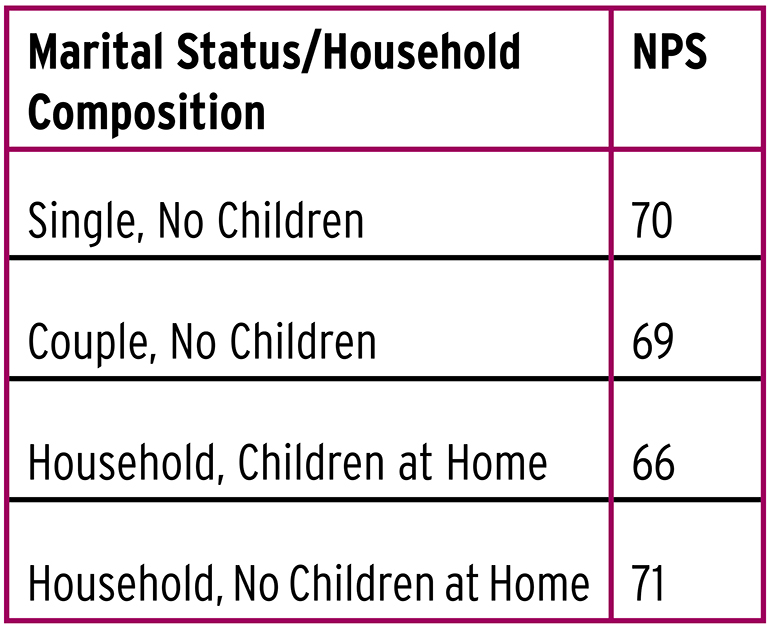
DOES MARITAL STATUS/HOUSEHOLD COMPOSITION IMPACT NPS?
The table below confirms a relationship between children and guest experience. The NPS of 66 for households with children at home is much lower than the other three segments. The NPS for households with young children at home would likely be lower than for households with older children at home as well.
WHAT DRIVES LOYALTY AND SATISFACTION?
To identify the key drivers or determinants of NPS and overall visit experience/satisfaction, we calculated the correlations of 16 survey attributes with the two overall loyalty and satisfaction attributes.
The three top drivers of “likelihood to recommend” were: recommend the resort’s lodging (for those resorts with lodging), overall level of fun, and overall ski/snowboard experience. The leading drivers of overall visit experience/satisfaction were: overall ski/snowboard experience, overall level of fun, likelihood to recommend the resort’s lodging, and overall family appeal.
Attributes that were not on average highly correlated with either the likelihood to recommend or the overall visit experience/satisfaction include: level of crowding, overall snow conditions, and overall food and beverage.
Detractors’ reasons for not recommending a resort varied by resort. The most common included: value for price paid, lifts/trails not open, staff friendliness/helpfulness, crowds/long lines, and snow conditions.
SUMMARY
The statistics herein are averages for Guest Research’s clients. Your resort’s statistics will vary, so dive into your own data to identify specific problems and opportunities that lie just beneath the surface of your overall loyalty and satisfaction ratings. This is the key to enhancing your guest experience and strengthening emotional ties, which will boost your repeat and referral revenues.
We recommend you identify your drivers with correlation analysis (conducted by you or your survey company), create KPIs for those drivers, and hold the responsible managers accountable to those priorities for improvement.