


The U.S. ski industry is at the top of its game both in participation and profitability. Both the 2023-24 and the 2024-25 National Ski Areas Association (NSAA) Economic Analysis of United States Ski Areas reports quantify and support the current financial strength of the industry. The most recent report shows a slight year-over-year decline in total gross revenue that was offset by a greater decline in operating expenses. Other key metrics combined for an excellent financial performance in 2024-25, when ski areas welcomed 61.6 million skier visits, the second highest visit total on record.
One word of caution when reviewing the 2024-25 Economic Analysis: ski area participation continues to strengthen, with 145 respondents (a figure that has steadily increased since 2021-22) providing a broader and more comprehensive industry snapshot. That expanded participation is a positive development, though shifts in the composition of responding resorts, particularly in the Midwest and Pacific Northwest, can create year-over-year variation in regional results that should be considered when interpreting those breakouts. Given the sample, national-level results remain stable.
Visitation
To analyze the 2024-25 Economic Analysis, it is best to look back over the past five years. Despite lasting social, emotional, and economic repercussions, the Covid-19 pandemic encouraged outdoor activity, and the U.S. ski industry has been a clear winner. More than 60 million skier visits were recorded for the fourth straight season in 2024-25, confirming realized growth in participation versus the occasional single-year peaks in skier visitation historically—probably boosted by ubiquitous season passes, which incentivize visits and practically guarantee a certain minimum visitation level.
Across the country, ski areas of all sizes performed well from a visitation standpoint, better balancing and broadening geographic participation.
By size. Going forward, skier visitation will be driven by medium, large and extra-large ski areas capturing a growing market share. Visits to ski areas in these three size cohorts have each grown roughly 15% over the past decade. Small ski areas continue to maintain historical skier visitation and importantly create new participants for the long-term health of the industry.
Regionally, Pacific Southwest ski areas saw a modest drop in visitation, which was offset by an 8% increase in revenue.
Night skiing has long been a core visitation strategy in the Southeast and Midwest, where 91% and 80% of respondents, respectively, offer it; most of the ski areas in these regions are in the small size category. Over the past decade, large and extra-large resorts have been adopting night skiing (up 67% and 100% from 2015-16, respectively) to spread visitation over a longer operating day.
A night skiing investment takes advantage of existing infrastructure, providing the guest more flexibility and value while generating incremental ticket and operational revenues at modest increases in operating costs.
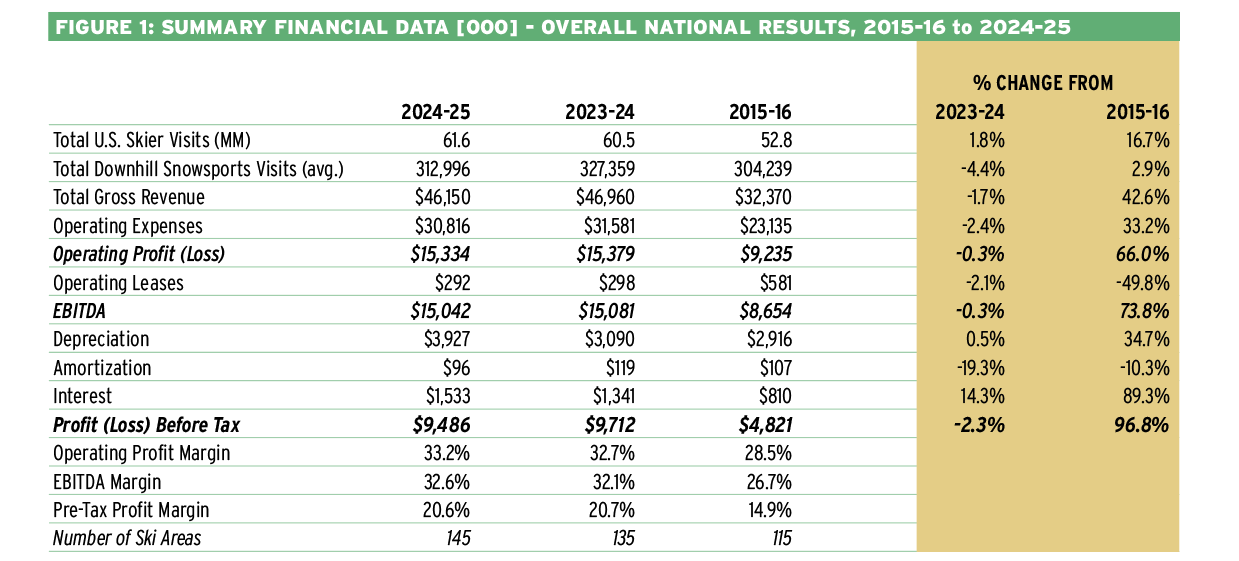 The financial performance of U.S. ski areas over the past two seasons quantifies the industry’s success. Discount season passes have fueled visitation growth, and overall revenue has risen faster than expenses, resulting in comfortable profit and EBITDA margins. Source: NSAA Economic Analysis of U.S. Ski Areas
Revenue
Non-ticket revenue was at a record high ($68.01 per skier visit) and materially a significant factor in the success of small and medium ski areas, even as it shrunk as a percentage of total revenues. Non-ticket revenue (snow play, food and beverage, rental, retail, ski school and lodging) for small and medium areas represents about 50%–55% of total revenue versus large and extra-large ski areas, where ticket revenue represents approximately 55% of total revenue.
F&B and ski school. Operations such as ski school, food & beverage, and rental/retail are important to the guest experience and, of course, generating revenue to improve ski area profitability. Food and beverage represents the largest percentage of ancillary revenue for all size cohorts, and ski school revenue across all sizes except small ski areas, which have remained flat, has grown 70% over the past decade, with ski school revenue at extra-large resorts now comparable to those resorts’ food and beverage revenues.
Rental revenue has grown 32% over the past decade, and a little more than 8% since 2018-19, the first season NSAA’s Kottke End of Season and Guest Experience report started tracking rental volume. According to the Kottke report, average rental volume per ski area has continued to rise since bottoming out in 2021-22, reaching 30,055 units last season, up 5% year-over-year and nearly flat to 2018-19’s average of 29,812. The Economic Analysis shows 2024-25 rental revenue was up a scant 0.1% year-over-year. The comparative lag with volume may suggest that equipment rental prices haven’t followed the steep increases of other products, like lift tickets. Rental revenue as a percentage of total revenue in the Southeast and Midwest is almost double that of the other industry regions.
These comparisons should be made with caution given the different sample sizes and sample compositions of each report, but it’s nonetheless valuable to understand the relationship between volume and revenue for insights into rental demand and new participant activity.
Lift revenue. On average, season passes now account for more than 50% of ski area lift revenue and 49% of visitation nationally. Multi-resort season passes (Epic and Ikon) were the early leaders in demonstrating the importance and value of built-in demand and predictable cash flow, and as a result, individual ski areas and the industry as a whole have adopted season pass strategies as the primary driver of lift revenue.
Other financial metrics. Because skiers spent more, industry financial metrics grew to new highs (per-skier-visit revenue of $147.44 and profitability of $30.31). Versus 2015-16, ticket and pass revenue has increased 60% per skier visit and pretax profitability per skier visit has nearly doubled, up 91%.
EBITDA and yield. EBITDA margins industry-wide remain strong at 32.6%. Labor remains the largest cost at 25% of revenue. Insurance costs were relatively flat year-over-year (down 0.6%), but have increased 187.6% in the last decade, by far the highest percent increase of any other expense.
Compared with 2023-24, 2024-25 skier visits were up 1.8% and revenue was down 1.7%, but operating expenses fell 2.4% with EBITDA performance remaining comparable for the two years.
Southeastern ski area results show strong financial efficiencies with revenue increasing 50% and operating expenses up 10% over the past decade. Profitability results by the industry demonstrate a yield-focused business model, increasing revenue from each visit, and expense management with operating expenses falling the past two years.
Historically, visitation has been the measure of success, but as industry business acumen has matured, a shift to efficiency, yield management, and driving revenue per visit signifies a more disciplined business model.
Summer activities continue to grow, with more than 80% of reporting ski areas engaged in summer activities, which accounted for an average of 12% of annual revenue in 2024. Summer operations also benefit year-round customer awareness and loyalty.
Balance sheets continue to get stronger, demonstrating the financial resiliency of the industry. Average net worth of a ski resort is $80 million, nearly double that of a decade ago. Balance sheet liabilities remain stable at 30%. Working capital is up primarily through improved liquidity (cash is king), better positioning the industry for investment and weather variability. Annual interest expense has increased an average of $200,000 (10%-20% over 2023-24, depending on region) as a result of higher interest rates post-Covid. While modest in dollar terms relative to overall revenue, the 14% overall year-over-year increase reflects the higher cost of borrowing and could temper the use of new debt as a source of funding.
Capital investments. The industry remains a capital-intensive business with more than $600 million of capital invested for the 2024-25 season and $560 million anticipated for the 2025-26 season (28% of annual ticket revenue) in lifts, snowmaking, base facilities, and guest amenities, which creates a competitive landscape for guest loyalty. Investment in the resort experience remains a significant factor in maintaining/growing visitation and market share.
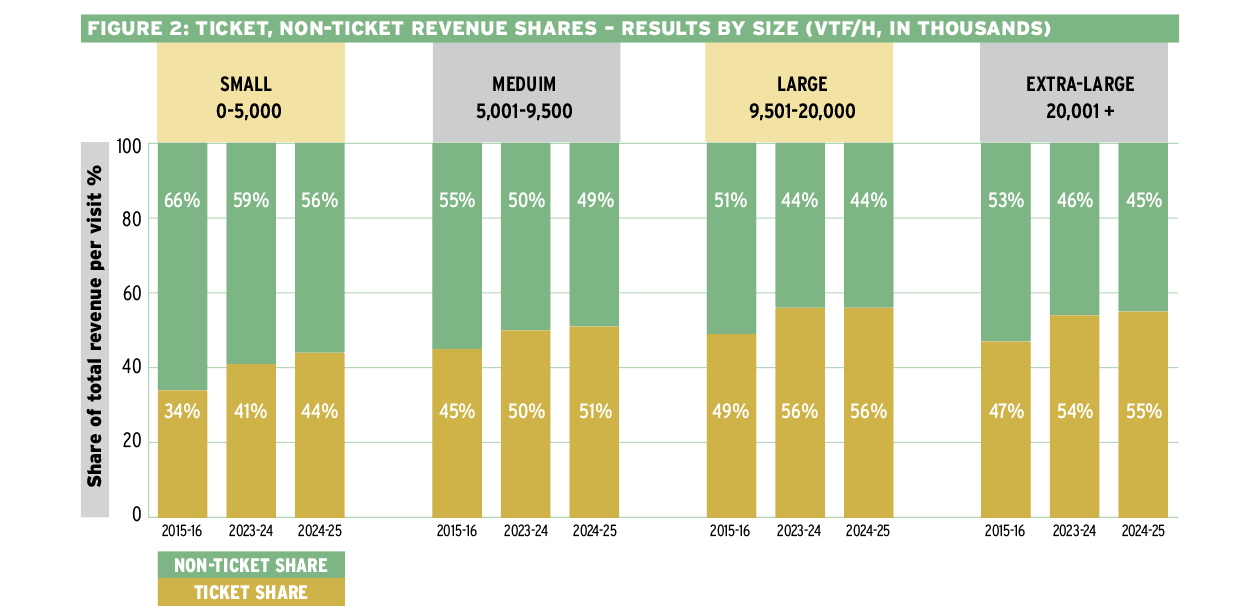 The widespread adoption of discount season passes has increased the ticket share of overall revenue, even as non-ticket revenue has reached record levels. Source: NSAA Economic Analysis of U.S. Ski Areas
Regional Snapshot
The following summary highlights year-over-year shifts in regional performance; the full Economic Analysis provides deeper, region-specific breakouts, including Excel workbooks with detailed revenue, expense, and margin comparisons for specific size cohorts within each region.
Northeast: Gross revenue up 18%. Operating expense up 6%. EBITDA up 18%. Operating profit before tax up 33%. EBITDA margin up 350% over 2015-16.
Southeast: Gross revenue up 10%. Operating expense down 2%. EBITDA up 35%. Operating profit before tax up 40%. EBITDA margin up 50% over 2015-16.
Midwest: Gross revenue down 18%. Operating expense down 15%. EBITDA down 20%. Operating profit before tax down 80%. EBITDA margin down 20% from 2015-16.
Rocky Mountain: Gross revenue down 7%. Operating expense down 7%. EBITDA down 8%. Operating profit before tax down 10%. EBITDA margin up 8% over 2015-16.
Pacific Southwest: Gross revenue up 10%. Operating expense up 7%. EBITDA up 10%. Operating profit before tax up 8%. EBITDA margin up 7% over 2015-16.
Pacific Northwest: Gross revenue flat. Operating expense up 3%. EBITDA down 13%. Operating profit before tax down 10%. EBITDA margin down 30% from 2015-16.
Snapshot by Size
The size-based snapshot below captures year-over-year cohort trends; the complete Economic Analysis offers more granular comparisons by size within region, along with department-level revenue and cost structures for each peer group.
Small: Gross revenue down 1%. Operating expense down 9%. EBITDA up 8%. Operating profit before tax up 6%. EBITDA margin up 180% over 2015-16.
Medium: Gross revenue up 2%. Operating expense up 7%. EBITDA down 2%. Operating profit before tax down 2%. EBITDA margin up 19% over 2015-16.
Large: Gross revenue up 15%. Operating expense up 9%. EBITDA up 30%. Operating profit before tax up 35%. EBITDA margin up 70% over 2015-16.
Extra-Large: Gross revenue up 5%. Operating expense up 5%. EBITDA up 6%. Operating profit before tax up 2%. EBITDA margin up 16% over 2015-16.
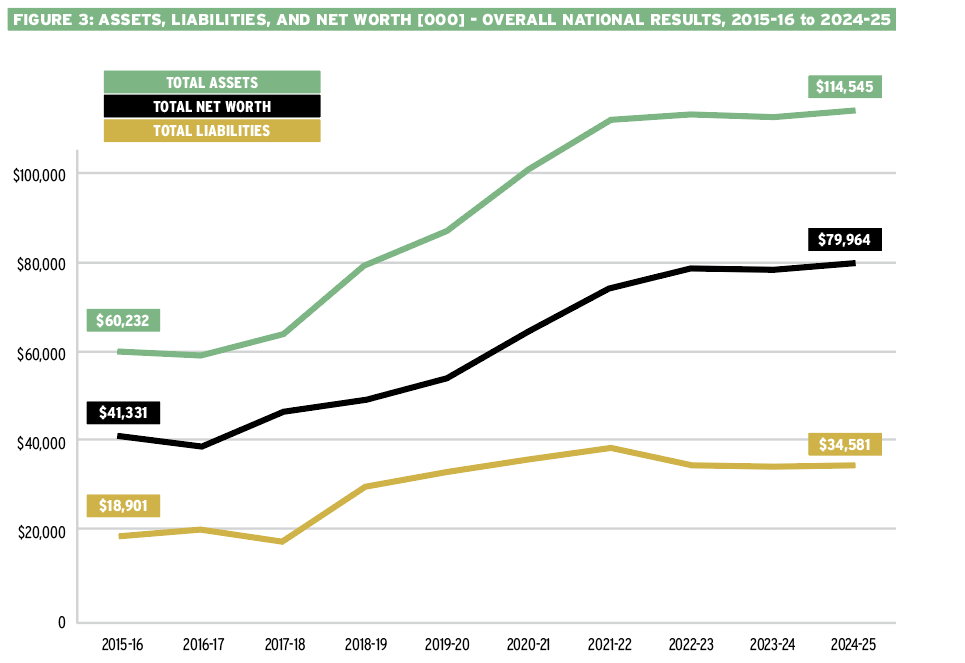 Assets and net worth of U.S. ski areas nearly doubled in the past decade. While the above figures represent the national average of all 145 reporting areas, regional figures vary widely. For 2024-25, total net worth ranged from $25.9 million in the Midwest to $164.8 million in the Rockies, for example. Source: NSAA Economic Analysis of U.S. Ski Areas
Looking Forward
The 2024-25 Economic Analysis clearly indicates the industry is not only enduring but evolving and better equipped to navigate uncertainty/weather variability and sustain its hard-earned success. This season will test that success at some areas.
The first half of the 2025-26 winter season was a tale of regional abundance and generational weather anxiety. Consistent winter snowfall in the East, Southeast, and Midwest built natural snow bases, generating market enthusiasm and participation. In the Rocky Mountain, Pacific Northwest and the Pacific Southwest, the worst snow drought in 50 years left resort operators and mountain communities studying long-range weather models and forecasts and hoping for a long overdue pattern change.
As a result, it is likely the final 2025-26 skier visitation total will be a weather impacted aberration and fall below the 60 million mark. Midwest, Eastern, and Southeastern resorts will generate strong if not record visitation, revenues and profitability, while Western resorts with strong season pass revenue will financially cushion a decline in visitation, but ancillary revenue (ski school, food & beverage, retail) will fall short of revenue targets, impacting overall profitability. Western mountain community lodging, restaurants, and retail businesses will experience similar shortfalls in revenue and profitability.
Participation considerations. Moving past the 2025-26 season, the industry needs to better understand participant numbers. NSAA and Snowsports Industries America (SIA) both undertake research to identify participants in alpine sports and winter sports/activity, with different results. Alpine skiing participation has been at record levels in recent years, but the inevitable aging-out of the Baby Boomer generation that has been the industry’s baseline of participation for decades suggests that without a concerted industry effort to reach new participants, skier visits are likely to decline over the next 10 years.
The season pass model has been a boon for industry participation and the resorts that utilize that strategy. To drive participants to season passes, many resorts have increased window ticket pricing to encourage season pass commitment. The downside of that approach is it creates a cost barrier for new entrants and casual skiers (1-3 days a season), who financially are not prepared to make that commitment to the sport/activity. The industry in the near future, with meaningful ski area participation, will have to create and implement a strategy that encourages new participants to try the sport to maintain participation levels and its financial health.