


Results from the 2025-26 SAM Technology Survey show ski areas are spending more on tech and treating it as a strategic asset, with a focus on integration, guest-facing tools and data-driven investment—even as cost pressures, staffing limits, and vendor constraints persist.
The Covid-driven wave of digital adoption hasn’t slowed for North American ski areas. In fact, according to the 2025-26 SAM Technology Survey, ski areas are now spending more on technology as they see pandemic-era tech investments paying off. More than 8 in 10 respondents to the survey said their technology budgets have increased over the last three years, and nearly two-thirds rate technology as strategically important (a 4 or 5 on a five-point scale).
At the same time, many ski areas are trying to modernize with small teams in complex, multi-vendor ecosystems with a resulting integration burden. In some cases, this means ski areas can be slower to update and maintain their tech and devote less energy to formal, long-term planning. Even so, ski areas are exploring new, future uses for technology as the possibilities continue to grow. AI is one obvious avenue, but there are several others as well.
Throughout the survey, another theme emerges: Investments are most valuable when they improve throughput, safety, or operational control in visible ways.
Methodology. SAM collected 76 responses from ski area professionals representing a broad mix of ski area sizes (by annual skier visits) and regions across the U.S. and Canada, plus a small number of international respondents. Results were aggregated and reported anonymously. Question-level bases vary because, as with any survey, some questions have a small number of non-responses.
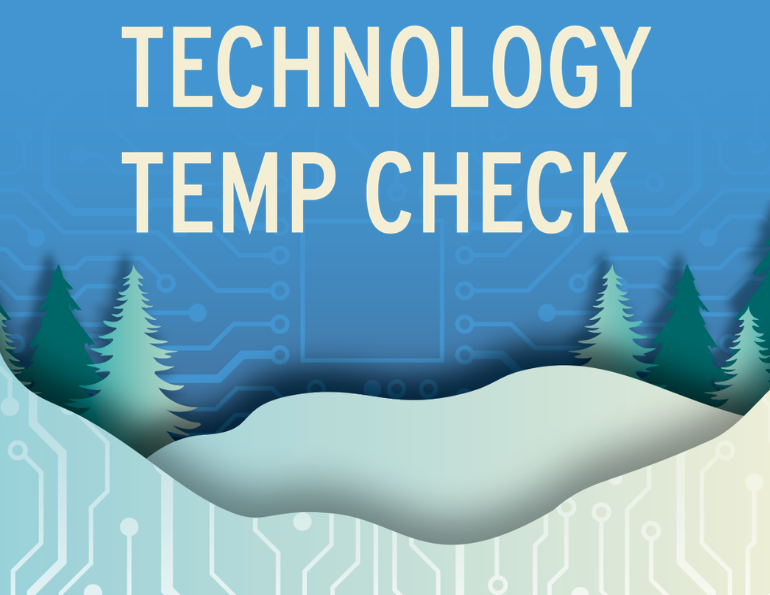
 Share of resorts in each size segment rating technology importance 4 or 5 on a 5-point scale, with 1 being “not important” and 5 being “most important.” Mean score shown in key.This report explores what ski areas said about where they are investing, what’s holding them back, what’s delivering measurable wins, and how they see AI evolving.
Throughout, we break results out by ski area size (Small, less than 100k visits; Medium, 100k-249k visits; Large, 250k-499k visits; and Extra Large, more than 500k visits). Subgroup bases can be modest in size, so subgroup findings should be read as directional only.
Budgets Up
At the national level, the story is clear: technology budgets are rising. Eighty-five percent of respondents said their technology budget has increased significantly or modestly in the last three years.
Budget growth is paired with a more favorable view of technology within organizations, with 64% of respondents rating technology a 4 or 5 in importance on a 1–5 scale, with medium, large and extra-large resorts more likely than small resorts to view technology as of significant importance to their organization.
About 39% of respondents reported spending 1–3% of their annual operating budget on technology. Another 32% spend 3–5%. The 1–5% range is common across resort sizes, although a few larger operations reported higher percentages.
Capacity
Headcount is more variable. Overall, 51% said their ski area has 2–5 dedicated IT/tech staff, while 18% reported having 0-1, with small ski areas (58%) far more likely to operate with 0-1 dedicated IT staff.
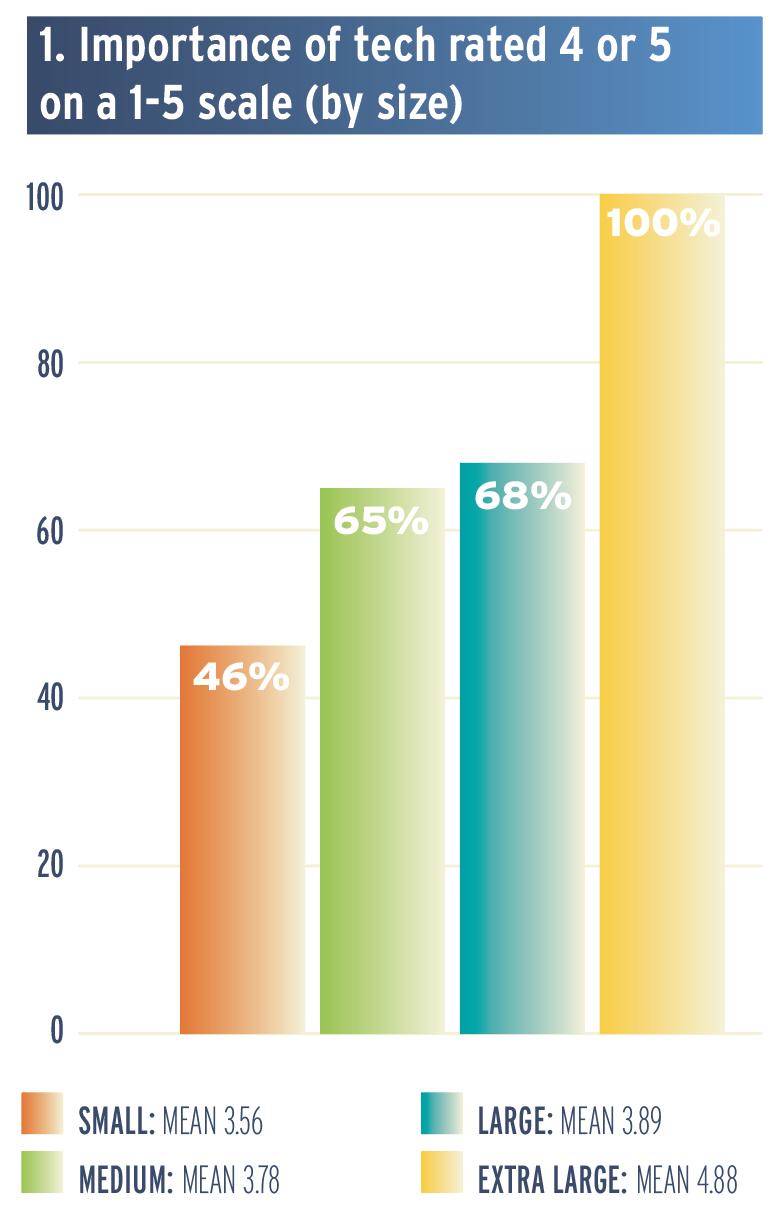
 Share of resorts in each size segment reporting that more than 74% of their systems are up to date. Percentages are within each size group.In perhaps a reflection of ski area consolidation, 43% of respondents have support from a central or corporate IT function. Extra-large ski areas are more likely to have corporate IT support (63%) than small ones (32%).
Training. Many respondents do not provide or require outside IT-specific training or continuing education for IT staff. Among respondents who answered the question, about half (48%) said that they do provide or require such training.
Maintenance policies. Nearly three-quarters of respondents said they have a standard policy for keeping supported hardware, operating systems, and security patches up to date. Almost all large and extra-large ski areas (88%) have policies for keeping up to date, but only about half the small areas (54%) do. Medium-sized ski areas sit close to the average at 78%.
Up-to-date systems. Regardless of policy, two-thirds of respondents said that they would consider 74% or more of their systems and infrastructure up to date. (See chart 2, right.) Small ski areas are less likely than the average to have at least three-quarters of their systems and infrastructure up to date, while medium, large, and extra-large are more likely.
When asked in an open-ended question why some systems aren’t up to date, cost was the most common theme among those who responded, with 38% mentioning cost or budget. Responses often included multiple themes. Vendor limitations and third-party dependencies were frequently cited (21%), along with hardware/OS lifecycle constraints (19%) and staffing/time limitations (13%). Compatibility or legacy dependencies showed up as well (12%).
There were some differences by size. For example, small ski areas that provided comment cited staffing/time and hardware/OS constraints more often than other cohorts. Large ski areas more often mentioned vendor dependency and cost.
One respondent from a medium ski area broke it down to “cost and functionality. … We tend to not be the first to sign on to new tech or implement updates as soon as available if not totally necessary. We prefer to make sure the tech is stable and bugs are corrected before updating or implementing.”
Another highlighted “time and availability of staff and competing priorities” as key obstacles.
Technology roadmap. When asked if they have a multi-year technology roadmap or master plan, respondents were divided: 29% (mostly extra-large) said yes, 29% no, and 41% said “somewhat.” Small ski areas skewed toward “somewhat” or “no.”
Stack Strategy
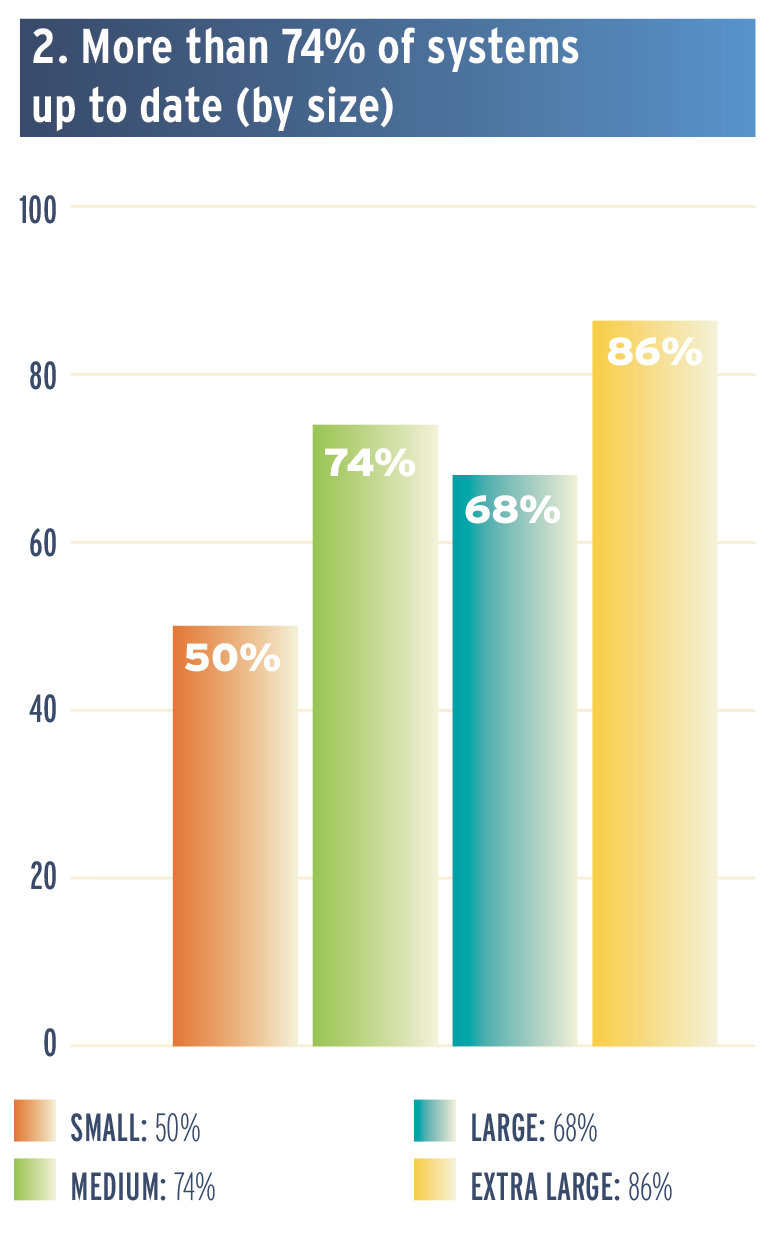
Deployment models for core operational systems tend to lean cloud-based. More than half of respondents said their core systems are primarily cloud-based or fully cloud-native. Another 38% said their systems are primarily on-premise with some cloud components.
 Cloud deployment is notably more common among small areas, with 71% primarily cloud-based or fully cloud-native. More than half of medium-sized respondents also fall into these categories. Large resorts tend to be hybrid: 74% reported their systems are primarily on-site with some cloud components.
This tendency toward hybrid solutions at larger ski areas may reflect more complex environments with legacy systems, local infrastructure investments, or specific physical operational functions that are not yet fully cloud-ready. For example, a ski area might run cloud-based commerce while keeping certain operational or identity systems on-site, especially when connectivity, latency, or legacy constraints exist.
Tech stack. Not surprisingly, among the current systems, software, and hardware in use at resorts, e-commerce or online booking platforms is the most common (92%), followed by digital waivers or forms (88%), finance and accounting technology (86%), and F&B systems (84%). (See chart 4, below.)
Use of drones or remote sensing (24%), enterprise resource planning (28%), and AI tools (37%) ranked lowest among tech currently being used, but were also all in the top six (out of 17) technologies that respondents said they are “considering,” led by drones/remote sensing at 36%.
The next wave of tech adoption appears geared toward operational efficiencies. The top technologies ski areas are currently “testing” include AI tools (24%); automation tools for operations, staffing, and reporting (21%); enterprise resource planning (12%); and dashboard/data visualization tools and drones/remote sensing, tied at 11%.
Best-of-breed vs. all-in-one. When it comes to technology acquisition, ski areas are balancing flexibility against simplicity. Best-of-breed is the most common approach: 49% reported using different vendors for different functions. All-in-one platforms are the second most common strategy at 29%, while 10% of respondents build or customize systems in house, and the remaining respondents were unsure or have strategies that vary by department.
Best-of-breed adoption rises sharply with resort size, with 33% of small resorts utilizing this strategy, 39% of medium resorts, 68% of large resorts, and 86% of extra-large resorts. The inverse is also true: Small ski areas are far more likely to prefer all-in-one platforms (46%) than large areas (11%). This suggests that bigger organizations are choosing flexibility and specialized capabilities, but they also anecdotally report more challenges with integration and vendor limitations. While smaller resorts, which tend to have fewer dedicated IT staff, seem to prefer all-in-one solutions.
There are also procurement and administrative dimensions to stack strategy. Best-of-breed can reduce dependence on any single vendor, but it increases vendor management overhead: contracts, renewals, security reviews, support escalation paths, and the ongoing work of keeping integrations functional as products evolve. All-in-one can reduce that overhead, but it concentrates risk if the platform lags on a critical feature or the vendor’s roadmap does not align with the resort’s needs.
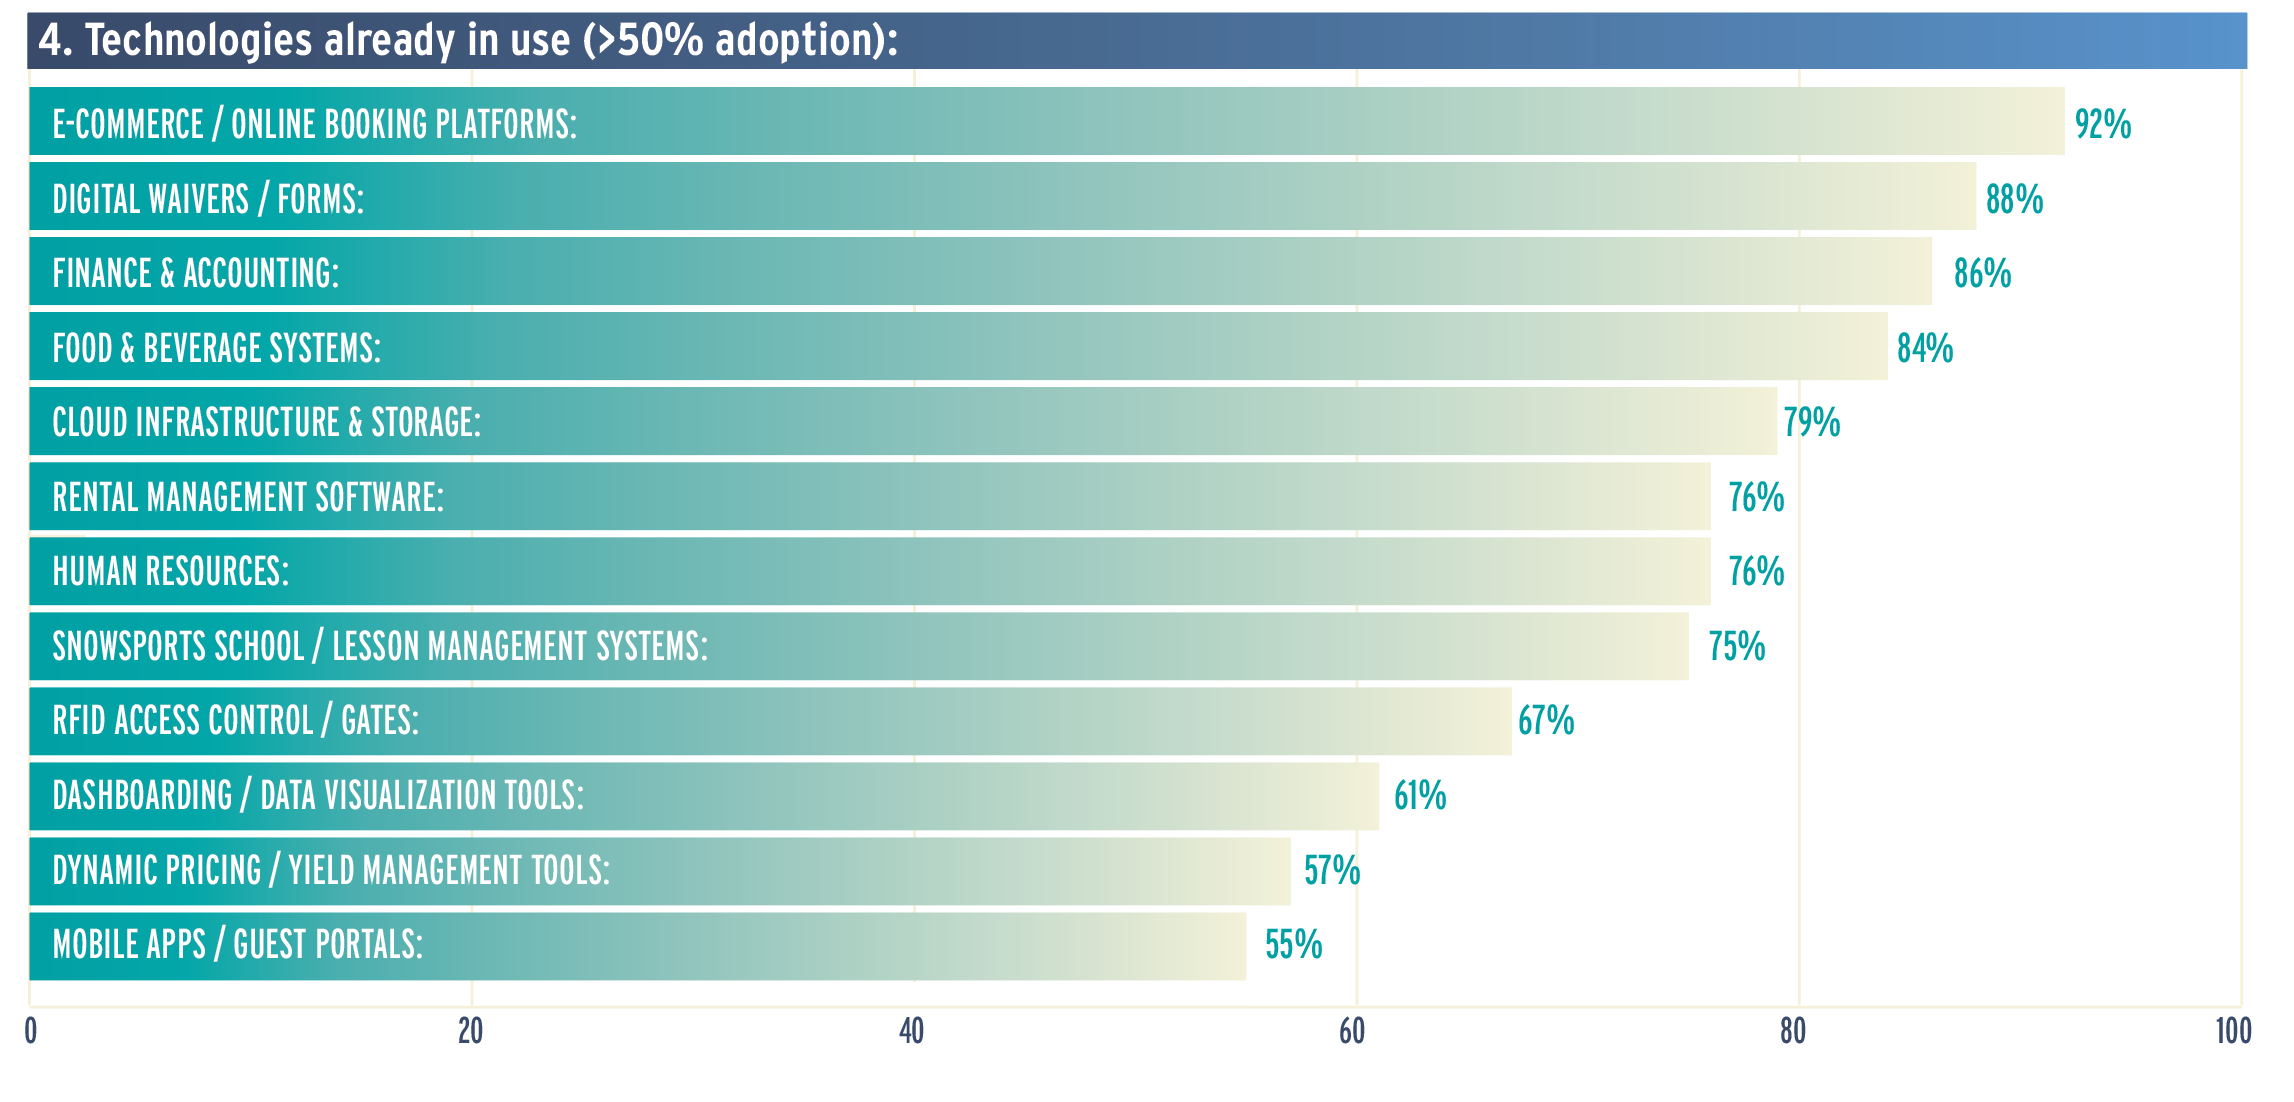 Percent of respondents who indicated each technology is already in use at their resort. Only technologies with greater than 50% adoption shown. Multiple selections allowed, so totals do not sum to 100%.
Systems Alignment and Friction
 To gauge how well today’s tech stacks are performing, we asked two questions: one about core systems’ overall alignment with operational needs, and one about where resorts feel the most day-to-day friction with their core systems.
Most respondents (56%) said their core systems align well or very well, but a large share (39%) described alignment as only adequate, while a small group (6%) said their systems align poorly or very poorly.
Extra-large and large ski areas are the most confident, with 68% reporting that their systems align well or very well. Small- and medium-sized ski areas are less likely to rate alignment that highly, each essentially split between well/very well and adequate.
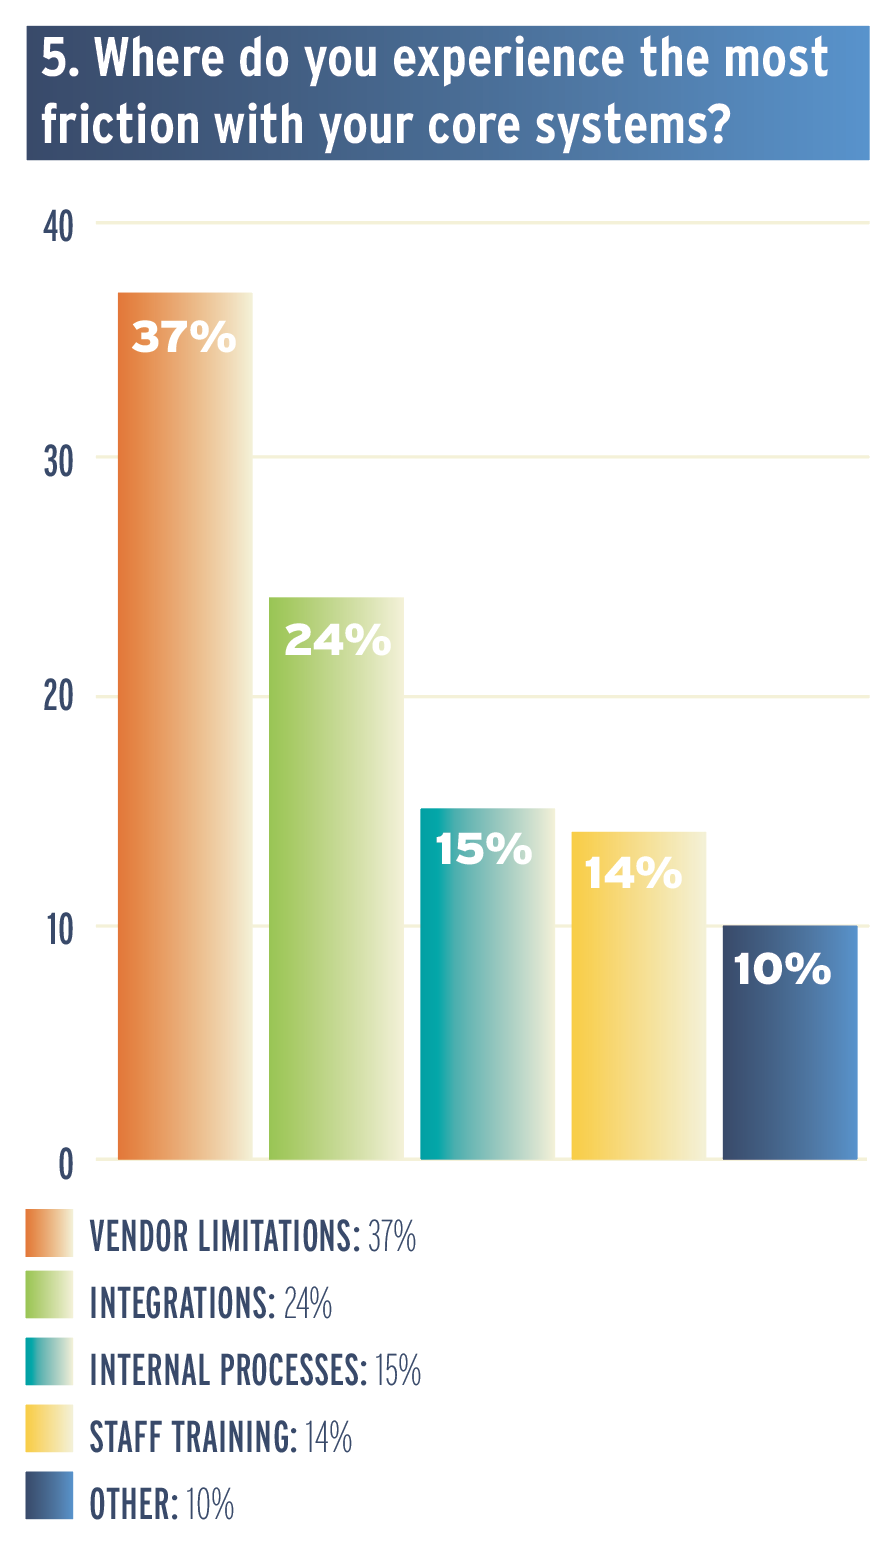
When asked where friction shows up most, the top answers point outward to vendor ceilings and system-to-system connectivity, more than inward to process issues. (See chart 5, right.)
Broken down by size, the main source of friction varies in a way that mirrors stack strategy. Large resorts over-index on integrations (50%), consistent with more complex, best-of-breed environments. Small resorts are relatively more likely to cite staff training (22%), reinforcing the idea that bandwidth can be as constraining as the tools themselves. Vendor limitations is the most common friction point for small (35%), medium (39%), and extra-large (57%) ski areas.
Data Management and Integration
Responses to a question about how ski areas approach data management suggest a landscape that is still in transition: 35% of respondents already have a unified system for reporting and analytics across departments, 38% are developing one, and 25% don’t have a centralized data strategy. A small segment, 3%, said they outsource data management to a third party.
Splitting the data by size shows that only 17% of small and 26% of medium-sized ski areas have a unified system for reporting and analytics across departments compared to 50% of large and 86% of extra-large ski areas.
Where will future tech investments focus? Among the top three options chosen by respondents, two are more internal—integration and data flow between departments (54%), and analytics and dashboards (42%)—with guest self-service/mobile experiences (52%) right between. (See chart 6, below.)
Current challenges. The investment priorities line up with what respondents said is hardest today. In an open-ended question about the biggest technology challenges they face, integration/data flow was the most common theme, with approximately a quarter of respondents to the question citing it.
“We’re working with a disjointed system of F&B, spa, mountain, and lodging that don’t talk to one another, limiting our ability to provide a comprehensive experience—and comprehensive CRM,” said one respondent from a medium-sized ski area.
Respondents used the term “integration” to mean different things depending on their environment and the nature of their operation. Some referred to the flow of data from point-of-sale systems to e-commerce, while others identified a broader need for ticketing, lessons, rentals, F&B and other departments to all share the same customer view.
Some talked about analytics as a downstream of integration: “We collect significant amounts of operational data … yet there is no unified system that integrates across the resort to keep and analyze this data,” a respondent from a large ski area said.
Other consistent challenges highlighted in the open-ended comments include cost, organizational alignment, change management, connectivity, and pace of change.
Small ski areas that responded to the question about biggest tech challenges more frequently cited connectivity and infrastructure as obstacles, followed by cost, while large ski areas were more likely to focus on integration/data flow.
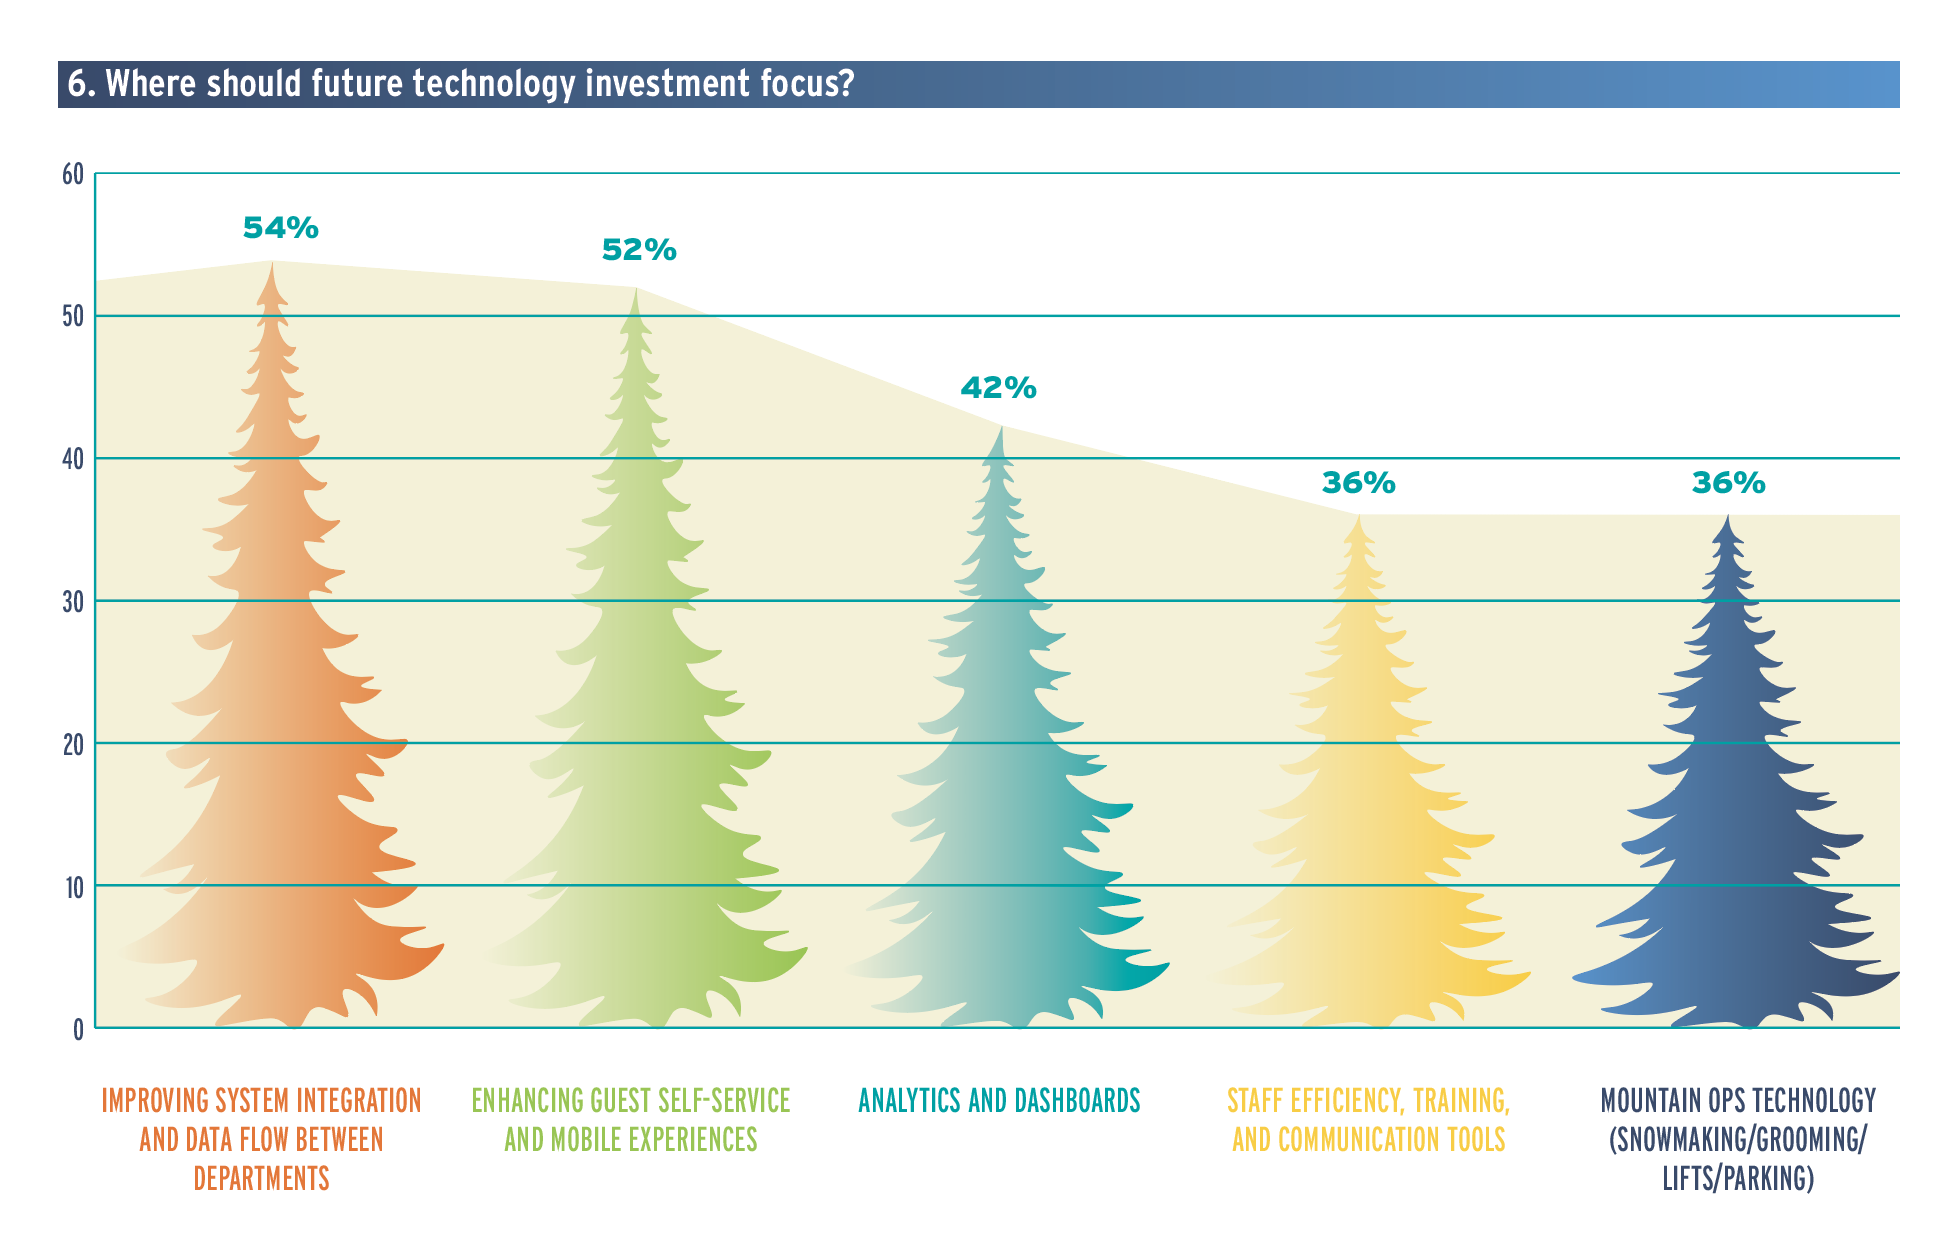 Percent of respondents who indicated each category should be a focus for future investment. Only top five selections shown. Multiple selections allowed, so totals do not sum to 100%.
Measurable Wins
While there are constraints, surveyed ski areas have had many tech implementation wins. Most respondents were able to describe a technology investment or investments that led to measurable improvements in efficiency, safety, or guest satisfaction. The strongest through-lines are investments that reduce friction in guest flow and purchasing, especially where the benefit is tied to throughput.
Among the top impactful investments cited in the open-ended responses were RFID and ticketing solutions and e-commerce platforms.
“Transitioning more products onto our e-commerce platform has drastically improved guest flow and streamlined staff workdays,” said one medium resort respondent. “RFID gate access, ticket kiosks and direct-to-lift products brought efficiency gains,” said another.
Several comments also pointed to operations tools—such as snowmaking automation, grooming technology, maintenance systems, and ops analytics dashboards—and more generally toward AI or automated processes as efficiency multipliers. (See chart 7, below.)
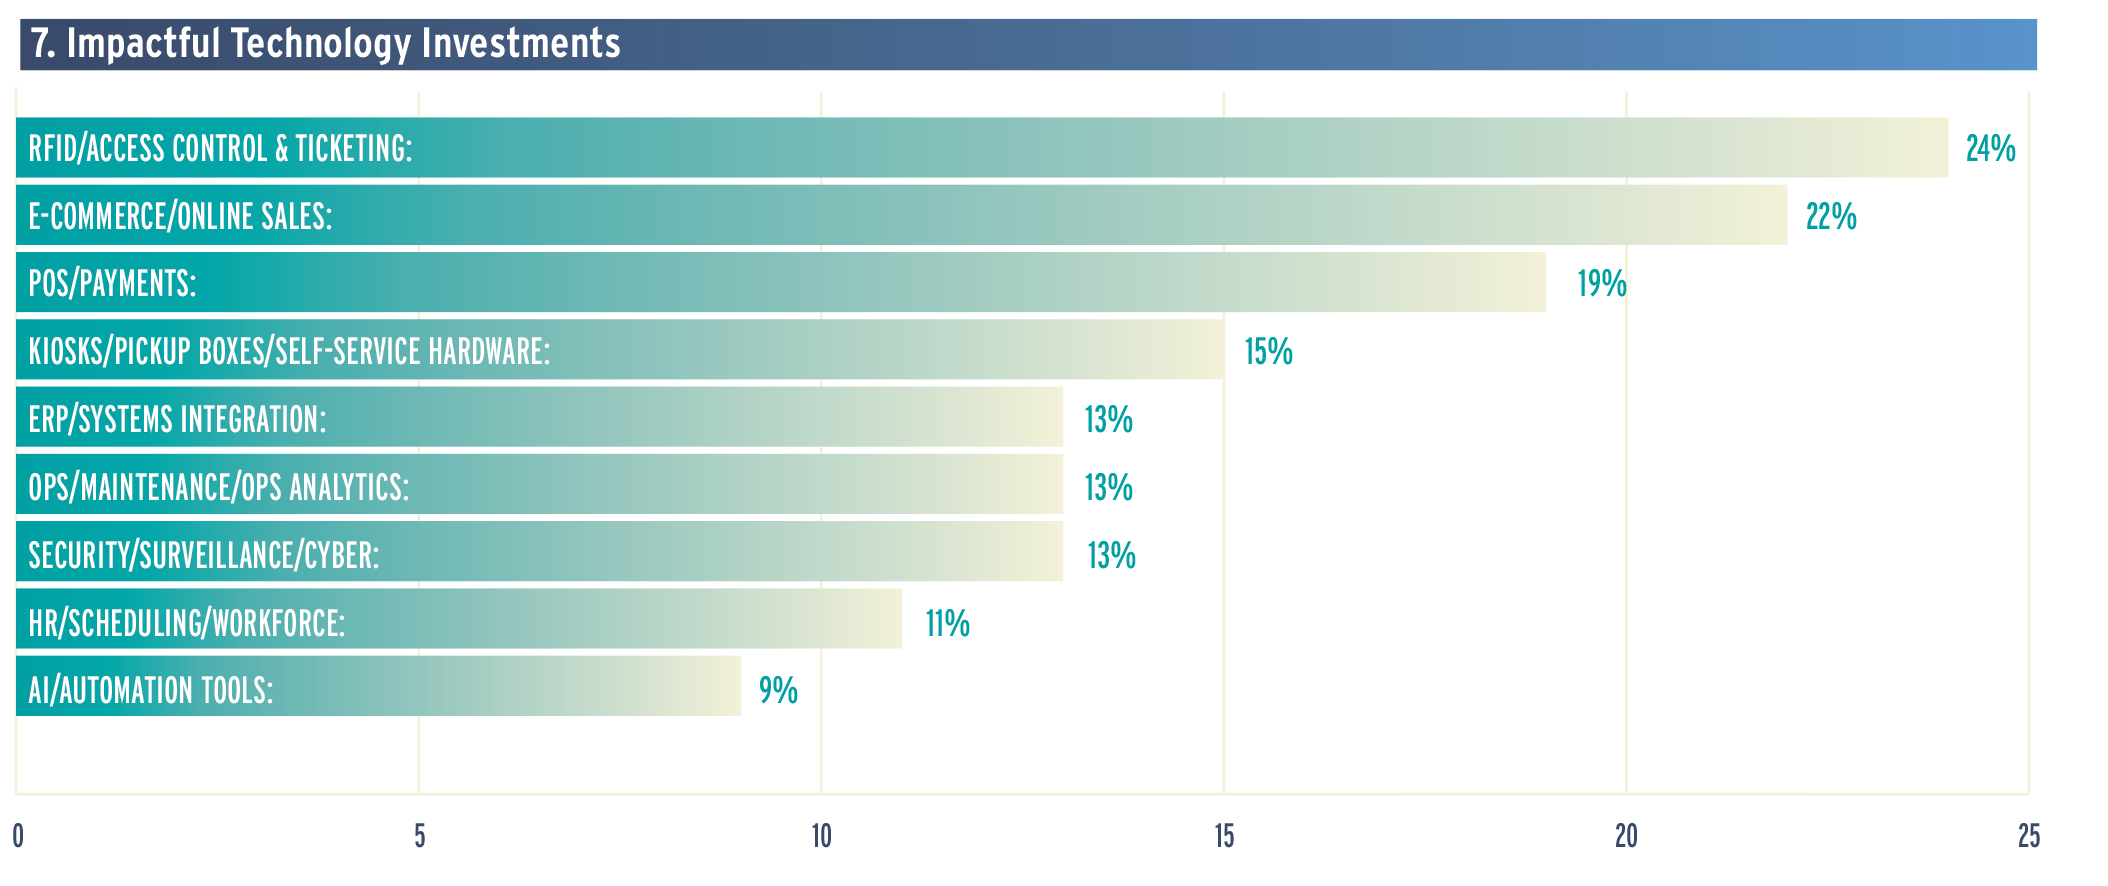 Open-ended responses to a prompt to “describe a technology investment that has measurably improved your efficiency, safety or guest satisfaction” were coded into themes; a single comment could be tagged to multiple themes. Percentages are based on total responses to the question.
Artificial Intelligence
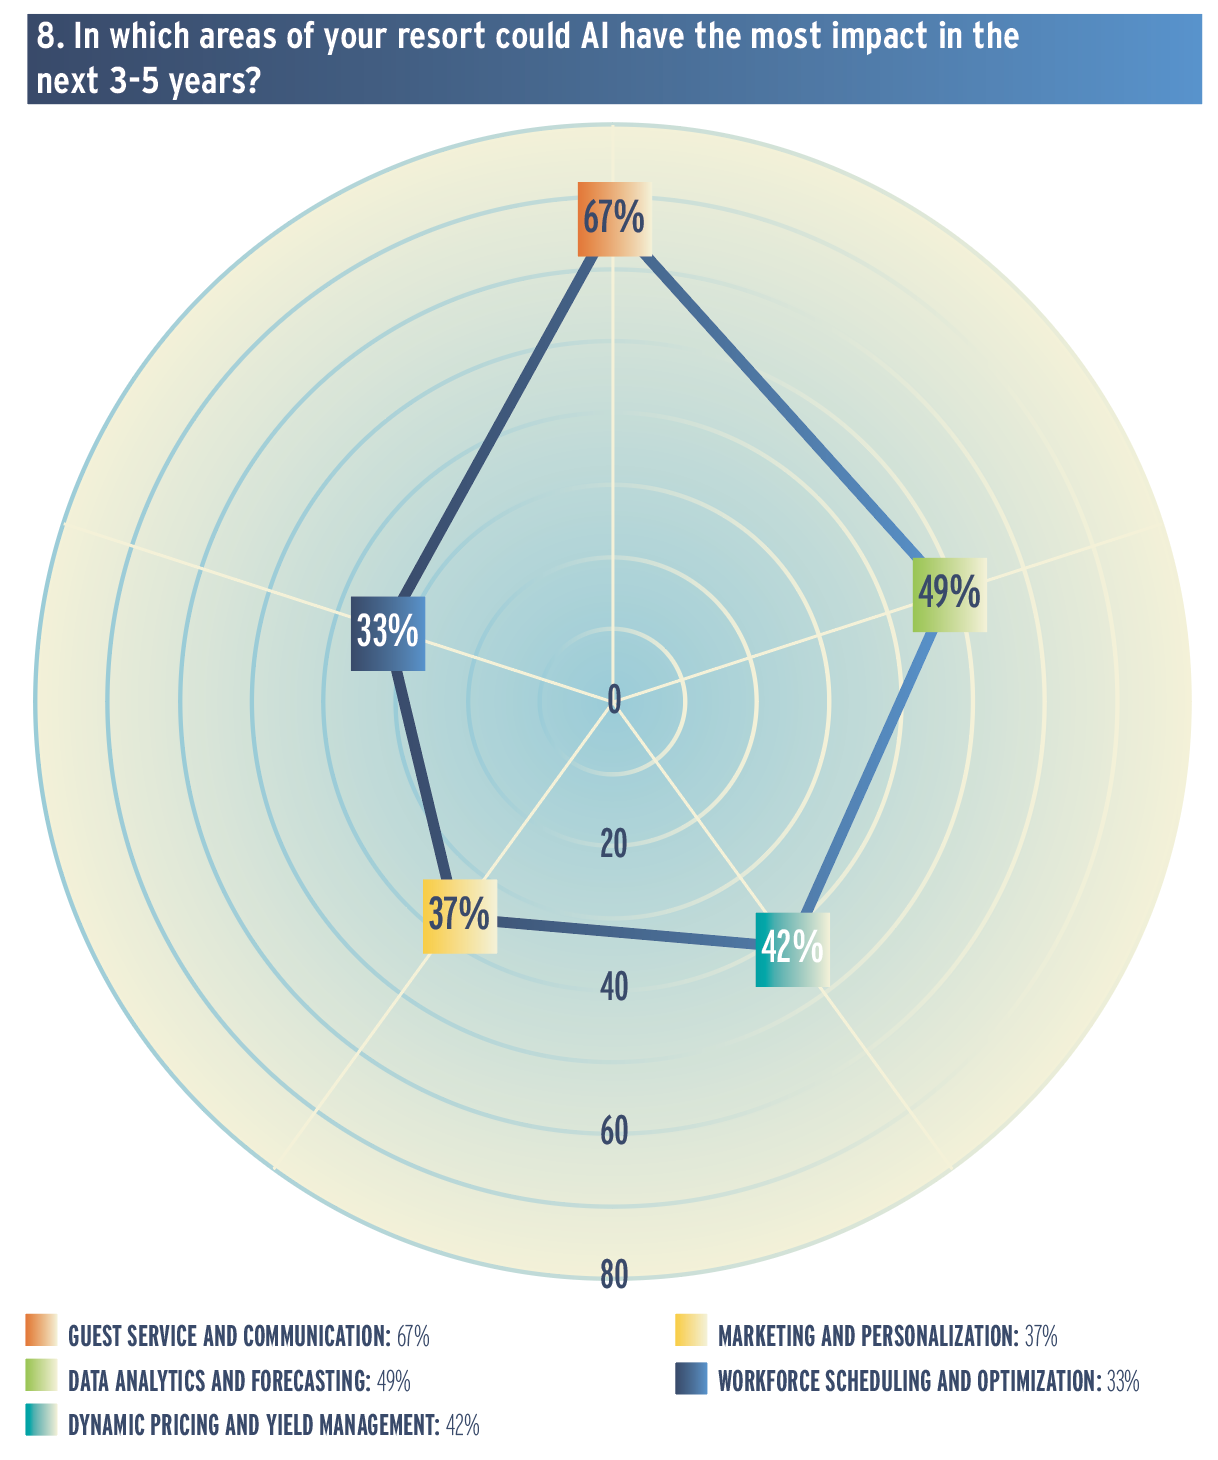 Percent of respondents who indicated a category was one in which AI could have a high near-term impact at their resort. Only top five selections shown. Multiple selections allowed, so totals do not sum to 100%.AI is no longer theoretical for a growing share of ski areas. Nationally, 37% of respondents said they are already using AI tools (e.g., chatbots, forecasting, personalization), and many more report that they are testing or considering AI.
While adoption is highest among extra-large resort respondents (75%), the interest in AI tools appears to be growing in all size segments, with 43% of medium resorts testing the tools and 43% already using them, and 42% of small resorts considering AI tools even though only 19% reported that they are currently using them. Among large resorts, 37% are already using AI tools, while another 21% are testing them.
When asked to look ahead, resorts see AI’s impact clustering around guest service and operational decision support. (See chart 8, right.)
What’s Next
Responses to an open-ended question on tech trends and innovations about which respondents are excited reinforces the potential they see in AI to improve guest communications, and support operations, monitoring, and reporting.
“Obviously the big one is the potential in efficiencies, reporting, operations, targeted interventions, etc., that AI can be utilized for,” said one medium resort respondent.
“AI in general, especially support operations like guest-facing chatbots,” said another.
A few temper their enthusiasm with caution. For example, one large resort respondent is excited about the potential for AI in supporting call center needs, but noted that they’ve been wary to implement the technology thus far because of “legality concerns.”
Other responses to the question map against the opportunities raised throughout the survey, with a focus on integration, guest experience and analytics.
Integration. Other than AI, respondents are looking forward to greater interoperability across their systems. One medium resort respondent is excited about “More ‘all in one’ POS systems that integrate data analytics and CRM.”
“Integrated ski area systems seem to be moving in the right direction,” observed a small resort respondent.
Guest self-service. Resorts are also excited about opportunities to reduce friction in the guest journey, from access control to communication.
One respondent from a small ski area is watching “the evolution of no-touch gates and streamlining the guest experience overall.”
A large resort respondent is similarly excited about the prospective ability to “Deliver a seamless, app-enabled guest experience (lift access, snow reports, messaging…).”
Ops tools. A smaller set of comments highlighted ops tools like snowmaking and grooming technology and risk management tools like lift terminal cameras, consistent with the broader theme that investments are most valuable when they improve throughput, safety, or operational control in visible ways.
For vendors and partners, the implication is consistent with the rest of the survey results: ski areas don’t just need features; they need interoperability, integration-friendly product design, and clear roadmaps. The challenge for ski areas is investing in the foundations of data collection, data policies, and staff bandwidth that make their software and systems pay off.
Closing Note
Thank you to the participating ski areas and respondents for sharing your time and insight. We hope this report helps operators benchmark their own technology position and see where peers are finding measurable wins.
SAM is grateful for the group of ski area tech experts who helped us fine-tune the survey and assess the aggregated and anonymized results. Further, analysis of quantitative findings and open-ended comments was supported by an AI tool developed by Eternity.