North American ski area marketers offered a bevy of interesting insights about their budgetary and staffing circumstances, preferences and strategies, concerns, successes, missteps, and much more in their responses to the inaugural “Outlook on Resort Marketing” survey, produced in a collaboration between MMGY Origin and SAM. Here, we present a sample of some of the aggregated survey results and analysis that can be found in the full report, which will be available this summer.
While every resort in North America is different and has unique challenges, we hope this report will provide marketers and management with points of comparison, different learnings, and some opportunity to better situate where their resort sits in the landscape.
METHODOLOGY AND RESPONDENTS
The anonymous survey was distributed via email to ski area operators in early February 2024 and promoted by SAM and MMGY Origin. It received 68 responses from marketers representing ski areas of all sizes in 21 states and four provinces across Canada and the United States.
Most respondents (69 percent) were from resorts with annual skier visits of 250,000 or less, and the most common role (40 percent) was marketing director. Roughly 48 percent of respondents were from the western U.S., 32 percent were from the eastern U.S., 15 percent were from Canada, and 5 percent were from the midwestern U.S.
Respondents had five options to choose from to identify the size of their resort by skier visits, ranging from less than 100,000 up to more than 1 million. Given the ratio of sizes in the sample, in some instances we’ve broken down the size cohorts a little differently for analysis purposes: smaller (less than 100,000 visits), mid-sized (100,000-250,000 visits), and larger (more than 250,000 visits). The referenced sizes are identified in the analyses.
Further, when relevant, we’ve broken down results by resort size and/or location; the full outline will be provided in the complete report.
KEY TRENDS AND INSIGHTS
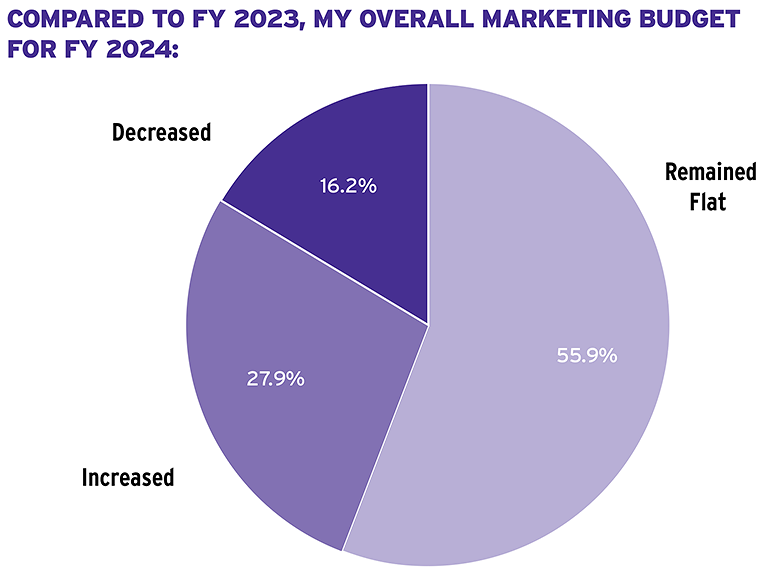
Budgeting: More than half (56 percent) of the respondents reported a flat marketing budget for FY 2024, with many citing a difficult start to the season and others saying business levels have reached a point that they don’t need to grow any more as reasons. Some increases were attributed to exploring new markets and increasing digital advertising spend.
Smaller resorts (less than 100,000 visits) often cited economic conditions and the need for increased marketing efforts as reasons for budget changes. Mid-sized resorts (100,000-250,000 visits) mentioned the impact of Covid-19 and the need to adapt to changing consumer behavior. Larger resorts (more than 250,000 visits) were focused on strategic initiatives, the cost of doing business, and adapting to market conditions.
Respondents reported marketing budgets of between 0.5-15 percent of annual revenue, with an average of roughly 4 percent of annual revenue going toward marketing—double that of the 2022-23 national average reported the NSAA Economic Analysis, and equal to the national average from 2013-14. It is commonly recommended that businesses spend between 5-10 percent of annual revenue on marketing.
What respondents said:
“We’re flat because we are lacking employees in the marketing department.” [Midwest, less than 100,000 visits]
“The major reason for the increase was to start our winter advertising a little sooner in the season and to reach out to a slightly larger market than we have traditionally focused on.” [East, 250,000-500,000 visits]
“Increase of budget as we’re trying to access new markets, new demographics, and a broader scope in efforts.” [British Columbia, less than 100,000 visits]
“Flat budget as we have found the sweet spot and don’t actually have capacity for more skiers during holidays and busy weekends.” [West, 100,000-250,000]
“This season has been challenging to say the least, almost entirely because of weather. We are relying on organic marketing and guerilla marketing and spending as little as possible.” [unknown, 100,000-250,000 visits]
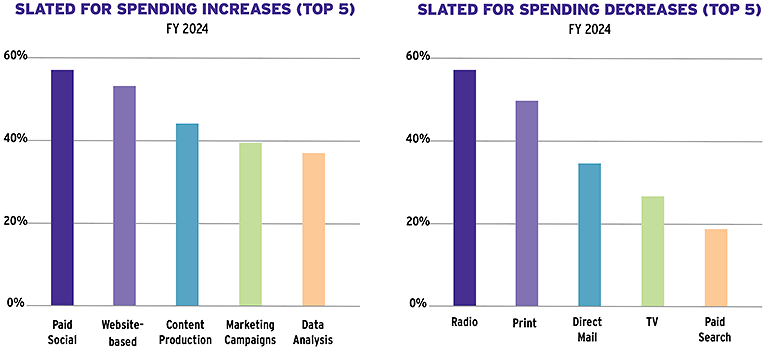
Marketing Channels: Digital and social media channels were reported to see increased investment and were ranked as the top two most prioritized categories in overall marketing budgets, respectively. Specifically, email marketing and social media platforms—particularly Facebook and Instagram—were commonly cited as the most productive channels for return on ad spend across all resort sizes.
Not surprisingly, Facebook and Instagram were the top two most prioritized channels for social media budgets by a wide margin. TikTok was fourth, after YouTube, and Pinterest was last out of seven options. Larger resorts emphasized the importance of data analytics and research in their marketing strategies—a benefit of digital channels—while some smaller resorts focus on direct mail and out-of-home to reach their audiences.
Respondents are spending less on traditional channels like print and radio, but traditional media ranked third out of six options in overall budget priorities. Travel/consumer shows ranked last in overall budget priorities, likely because they are typically one-off events that do not consume much budget. This sentiment may not reflect the overall comeback consumer shows have been experiencing in recent years for certain regions.
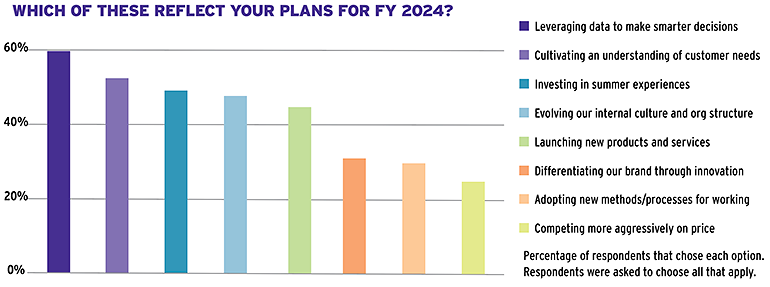
 Bars represent the percentage of respondents that chose each option from a list of 20 budget considerations. Respondents were asked to choose all that apply.


Staffing: Roughly 80 percent of respondents had year-round marketing teams of five or less staff members, which reflects the size of the resorts in the survey sample.
Interestingly, 54 percent do not hire seasonal marketing staff, and only 42 percent have a snow reporter role on their team, which suggests snow reporting duties fall to any number of other staff members who must arrive bright and early and update the report during the day as needed while also serving in their regular job functions.
Most resorts (81 percent) plan to maintain their current marketing team size in FY 2024, with some looking to add roles in content creation and social media.
Biggest Concerns: When asked what concerns them most in FY 2024, the most common responses included algorithmic changes that affect advertising and organic social media, as well as staffing, consumer trends, and the impact of global warming on ski conditions. Pricing was also mentioned.
What respondents said:
“Keeping up with the consumer trends on social media, as we are a very small team and it takes a lot of time to follow trends and create relevant content.” [West, 100,000-250,000 visits]
“Algorithmic changes and the ever-growing landscape of AI. The pay-to-play aspects of social media are also becoming more prevalent, and for resorts with smaller marketing budgets who rely on organic engagement, that’s problematic.” [East, 250,000-500,000 visits]
“1. Economy is by far the biggest concern; 2. Coming up with a creative marketing plan to drive attendance; 3. Staffing.” [Southeast, less than 100,000 visits]
“Will skiing continue to be as popular as it was two years ago or will industry prices keep new skiers out of the sport?” [West, 500,000-1 million visits]
KEY HIGHLIGHTS BY LOCATION
(EAST VS. WEST AND CANADA VS. USA)
In a general sense, East Coast resorts are more concerned with weather variability and its impact on consumer confidence while West Coast resorts are focusing on expanding summer experiences and leveraging data for decision-making.
At a high level, we see that Canadian resorts are emphasizing the importance of brand differentiation and innovation while U.S. resorts are more likely to invest in content production and platform implementations.
USE OF AI
Notably, the question “Is your resort using AI?” generated an equal 50-50 split with half of resorts using it actively and half not at all. The most common uses of AI among resorts include:
- ChatGPT for copywriting, social media posts, SEO, and press releases.
- AI photography usages and image generation.
- Customer service, including chat and online review responses.
- Aggregating data and providing summaries (guest surveys, online reviews, etc.).
LEARNING FROM MISSTEPS
“What common missteps have you learned the most from over the past year?”
This question generated a ton of great responses (the full report will include them all). The most common answers were about social media missteps. Marketers learned the need to be careful with responses, that locals will be chiming in on every post with strong opinions, and the need to be consistent with brand tone of voice across different seasons and product offerings.
A few resort marketers expressed the need to be more aggressive with packaging and promotions earlier in the buying cycle. The importance of investing in staff and being transparent were also common themes.
Some lessons learned:
“The need to be better prepared from a content planning standpoint to ride out a weak start to winter. Having content strategies that aren’t so on-snow dependent but will still captivate and entertain our audience.” [East, 250,000-500,000 visits]
“It’s easy to get too focused on customer-facing communication. Internal communication is sometimes just as important. Arm your front-line staff in all departments with solid information so that they can be good salespeople.” [West, 100,000-250,000 visits]
“Being methodical about reaching into a new market to create a great experience (we stepped into a new international market with a different language and were unprepared to deliver a great experience and proper info.).” [West, 250,000-500,000 visits]
THERE’S A LOT MORE
This is only a small sample of the data and insights that can be found in the full “Outlook on Resort Marketing” report. We hope this provides value to you and your marketing efforts.
Speaking of value, our aim is for this soon-to-be-annual survey and report to be an indispensable tool for ski area marketers for years to come. After you’ve read this topline—but especially the full report—we invite you to share any suggestions and/or feedback you have for future improvements: email dave@saminfo.com with the subject “Marketing Outlook feedback.” Thanks to everyone who provided input for development of the survey. We look forward to a much larger survey response next year.
The full report will be available this summer.


