


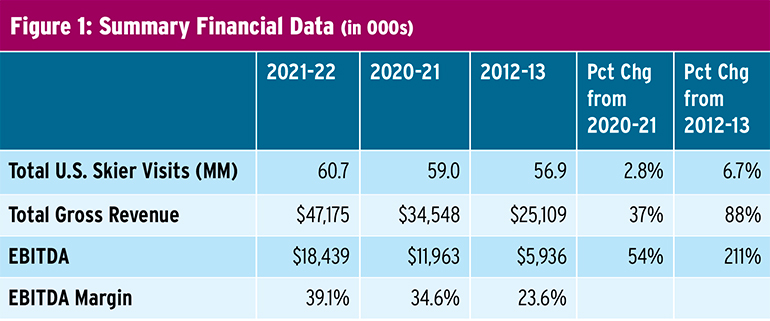
The 2021-22 Economic Analysis of United States Ski Areas is a good news story for the industry after two challenging years of battling the Covid pandemic. The industry emerged healthier than ever. The 60.7 million skier visits were a record, as were gross revenues, EBITDA, and operating margins. For a year with below-average snow across much of the industry, that’s impressive.
Gross revenues on average were up 36.5 percent over pandemic-limited 2020-21 while EBITDA grew by 54.1 percent and EBITDA margins improved to 39.1 percent, an all-time record and a nice improvement over 34.6 percent a year earlier.
DESTINATION REBOUND
While most reporting resorts showed strong financial performance compared to 2020-21, results did vary by region and by size. For example, gross revenues for the extra-large resorts were up 30.4 percent, but the smallest saw only a 10.7 percent increase. Clearly, guests returned to the largest resorts after limitations in 2020-21 curtailed visits, but smaller areas retained a good portion of their Covid guests.
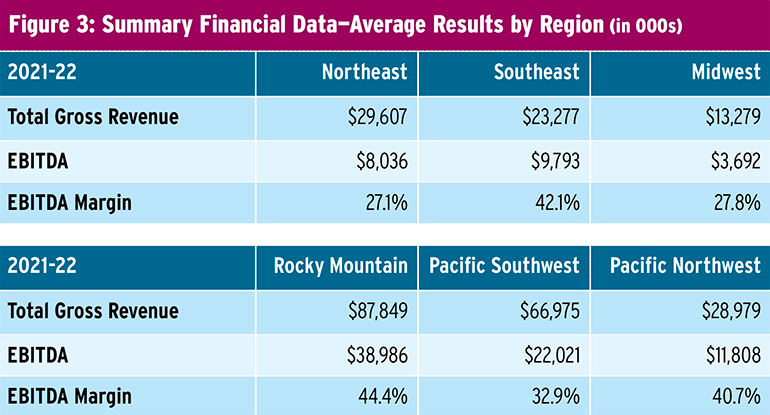
Looking regionally, the Pacific South saw gross revenues grow by 66.5 percent over the prior year, while the Southeast saw only an increase of 12.8 percent. Snow conditions of course vary regionally and greatly influenced skier visits and financial performance.
Long-term growth. Year-over-year comparisons are important to analyze, but the Economic Analysis also provides data over a 10-year period, so we are able to see trends and analyze longer-term performance. Over this period we saw impressive growth in average gross revenues and EBITDA, up 87.9 percent and 210.7 percent, respectively, from a decade ago. Those are compound annual growth rates of 7.3 percent and 13.4 percent, respectively.
Here, too, results varied by region. The Pacific South region saw revenues 131.8 percent higher than the 2012-13 season while the Midwest saw revenues higher by only 24.9 percent. Unfortunately, the report does not include 10-year data by size.
PASS POWER
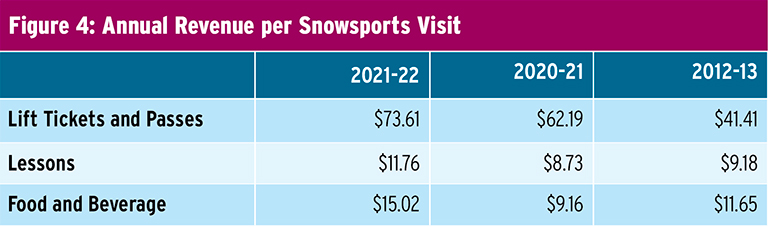
Examining revenue in more detail shows that lift tickets and season passes became a larger percentage of total revenues over the decade. In 2021-22, they were at 53.8 percent on average. A decade ago, they were 47.7 percent of revenue. While we only have season pass data for three years, it is also noteworthy that passes are now 46.4 percent of lift and season pass revenue, up from 43.6 percent three years prior.
In my prior career at Merrill Lynch, we were intent on developing fee-based revenue to replace transactional revenue in order to take some of the cyclicality out of the business, and it is encouraging to see that this is now occurring across our industry. This is one statistic that I watched closely at Sugarbush, and we—along with many other areas, apparently—were successful in increasing our season pass revenue significantly this past decade. That’s an important achievement.
REVENUE GROWTH OPPORTUNITIES
While lift and season pass revenue showed excellent growth over the decade, the Economic Analysis shows that there are opportunities in other revenue categories that have not grown at the same rate.
Food & beverage was up 53.7 percent from a decade ago; on average, visitors spent $15.02 on F&B.
However, that represented 11 percent of total revenue on average in 2021-22, less than the historic range of 13-14 percent. Not all skiers and riders choose to dine at the mountain, but this does seem to be an area of further opportunity.
Different approaches to delivering F&B may be one of the ways to increase the F&B yield. During Covid, we saw our guests getting comfortable with online ordering and eating and drinking outdoors, even on the cooler days. We can explore other options now that guests can choose to dine indoors once again.
Lessons, at 8.6 percent of revenue, increased a similar amount from a decade ago (52.7 percent) and yielded $11.76 per skier visit. But lesson revenue has also been declining as a percentage of revenue. Here, too, there seems to be an opportunity to increase revenue both through traditional offerings as well as focusing on demographics differently. For instance, Baby Boomers are skiing longer than prior generations and many have a “Peter Pan” mentality. However, as one ages, one changes physically and skis differently and could use instruction on how to continue enjoying this activity to the fullest.
Summer revenues, while still small compared to winter revenues, were at a record level in 2021 and up 76.1 percent from 2020, and 77.5 percent from 2012. For those resorts with summer operations, summer revenues represented only 11.6 percent of total revenues—down from 12.6 percent a decade ago. Summer F&B and retail were both well below 2019 levels, indicating they had not fully recovered from the limitations imposed during the pandemic.
For the first time, the Economic Analysis broke out groups/weddings/conferences as a separate category. This, along with lodging and F&B, represented 45 percent of summer revenues. 2021 also saw strong growth in both golf and lift rides (up 54.5 percent and 57.3 percent, respectively), which likely was the result of people feeling that these were safer activities given the pandemic. It will be interesting to see if the growth continues.
While summer revenues are still relatively small compared to winter revenues, they, too, represent an opportunity for further growth. Just as important, summer activities allow for year-round employment for many.
CAPACITY TO GROW
Our industry has long lamented the lack of real skier visit growth and worried about how we will replace Baby Boomers as they age and eventually move on. This remains a dilemma. While the record visitation number was a reason to celebrate at last spring’s NSAA National Convention, it is important to remember that 2021-22 skier visits were only 6.7 percent higher than a decade ago.
Our industry has shown that it can adapt and innovate. We have seen a solid improvement in the revenue captured per skier visit. However, the nominal growth in visits from a decade ago is a concern. Growing skier visits and converting first time skiers and riders to committed participants must remain a focus for the industry.
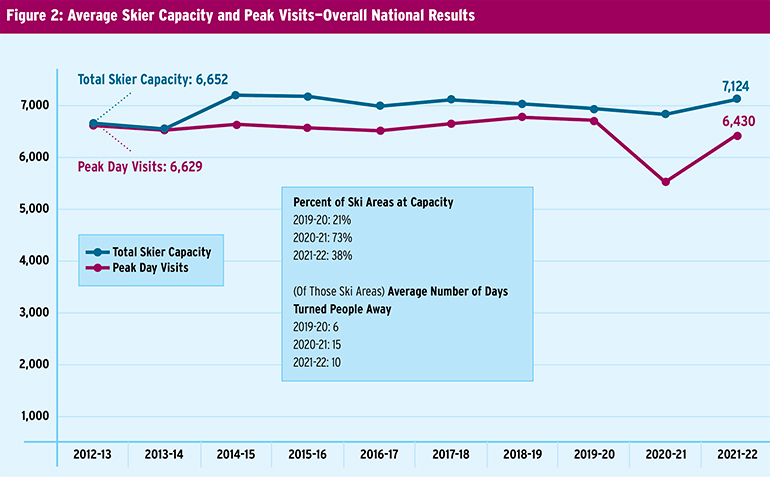
Peak day visits below peak capacity. Some may question this, as many in the industry were criticized for crowding on certain days. Photos of long lift lines and traffic jams went viral. Some have said that we should reduce our focus on bringing more skiers to the mountains and refocus on providing better guest service.
However, the data on the comfortable carrying capacity and the vertical lift capacity in the industry shows that more visits need not lead to overcrowding. The Economic Analysis demonstrates that the average carrying capacity grew from 6,652 ten years ago to 7,124 in 2021-22. Peak-day visits as a percent of skier capacity were 99.6 percent during the 2012-13 season, but just 90.3 percent last season. Former Vail Resorts CEO Rob Katz pointed this out during his remarks in Nashville last year.
Maintaining customer service. This is not to say that there were not terrible guest service issues at times in 2021-22, especially over the Christmas/New Year’s holiday when some resorts were less than fully open, or that perceptions are not important. However, growing visits and providing our guests with an excellent experience are not mutually exclusive. I am confident that the industry will address the issues and make the necessary improvements to continue growing skier visits and delivering excellent guest service.
We are already seeing this with initiatives such as paid parking, carpooling, dynamic pricing, and reservations for passholders. I am always reminded of Yogi Berra’s wisdom when he said, “No one goes there anymore; it is too crowded.”
BALANCE SHEETS IN BALANCE
Looking at the balance sheet, it is comforting to see that the industry’s assets have grown significantly over the past decade. While debt has grown as well, strong financial performance has seen a growth in equity.
Proper debt structure. While balance sheets are strong today, the cheap and easily available credit we have seen this past decade—as well as a huge infusion of cash when Covid hit in 2020—are unlikely to return for some time. Therefore, keeping a keen eye on the amount of debt that should be carried on the balance sheet will be important in the years ahead. The past has shown how toxic over-leverage can be. In a cyclical business, one must always be mindful of having the proper debt structure that can be managed in down years.
In summary, 2021-22 was an incredibly successful season for the industry, and that is a testament to the talent throughout our member resorts. Having a tool such as the NSAA Economic Analysis of United States Ski Areas is very helpful in allowing all of us to continue to improve our operations. Having the broad participation that it does makes it the useful tool that it is. If you haven’t participated in the Economic Analysis, perhaps now is the time to start.
Win Smith owned Sugarbush, Vt., from 2001 to January 2020, when he sold it to Alterra Mountain Company. Prior to joining the ski industry, Smith spent nearly 30 years in the financial sector at Merrill Lynch.